
Photo by Andrew Neel from Pexels
Every major OpenAI model release, from GPT-4o to the o-series reasoning family and beyond, reshuffles the latency deck for every team that depends on the API in production. Routing changes, new inference infrastructure, and updated tokenizers all shift Time to First Byte (TTFB) and Time to First Token (TTFT) in ways that aggregate dashboards rarely capture. If you ship chat, search, or agent features backed by OpenAI, you need a monitoring strategy that survives these version transitions without scrambling after the fact.
This article walks through a concrete, metric-focused approach to tracking OpenAI API latency across major version upgrades in 2026, including what to measure, where to probe, and how to automate the comparison so your team catches regressions before users do.
TL;DR
- Major OpenAI model upgrades routinely change TTFB and TTFT profiles, sometimes improving global medians while degrading specific regions.
- Monitoring must cover multiple regions, not just your primary data-center location, to catch asymmetric regressions.
- Establish a latency baseline before each upgrade window and compare automatically afterward.
- Synthetic probes running daily from geographically distributed points give you the earliest signal, faster than user-reported complaints.
- Observinio's 21-region daily probes and degradation alerts are purpose-built for exactly this workflow.
Why major version upgrades break your latency assumptions

When OpenAI ships a new major model version, several things happen under the hood that directly affect the latency your application experiences:
- New inference hardware or partitioning. Capacity is reallocated. A model that previously ran on a warm cluster in
us-eastmay now share resources with a larger reasoning model, increasing queue time. - Tokenizer changes. A new tokenizer can change the effective prompt length for the same user input, altering both request size and processing time.
- Routing and load-balancing shifts. OpenAI periodically rebalances traffic across regions. After a major release, traffic spikes to the new model can saturate specific points of presence, creating regional hotspots.
- Deprecation cascading. When an older model version is deprecated, traffic migrates, sometimes automatically, to the replacement. If your application pins to a version alias like
gpt-4o, the underlying model can change without a single line of your code changing.
eu-west doubles. If your monitoring only tracks a single-region aggregate, you will miss this entirely until a European customer opens a support ticket.
What metrics actually matter
Not all latency numbers are equally useful after an upgrade. Focus on these:
- TTFB (Time to First Byte): How long until the API connection starts returning data. This captures network path and queue time.
- TTFT (Time to First Token): How long until the first usable token arrives in a streaming response. This is what your user feels in a chat interface.
- p50 / p95 / p99 by region: Medians hide tail latency. A healthy p50 with a spiking p99 means some fraction of your users are having a terrible experience.
- Baseline delta: The percentage change in each metric compared to the pre-upgrade baseline. A 30 ms increase on a 200 ms baseline is a 15 % regression, significant for real-time chat.
Building a pre-upgrade latency baseline

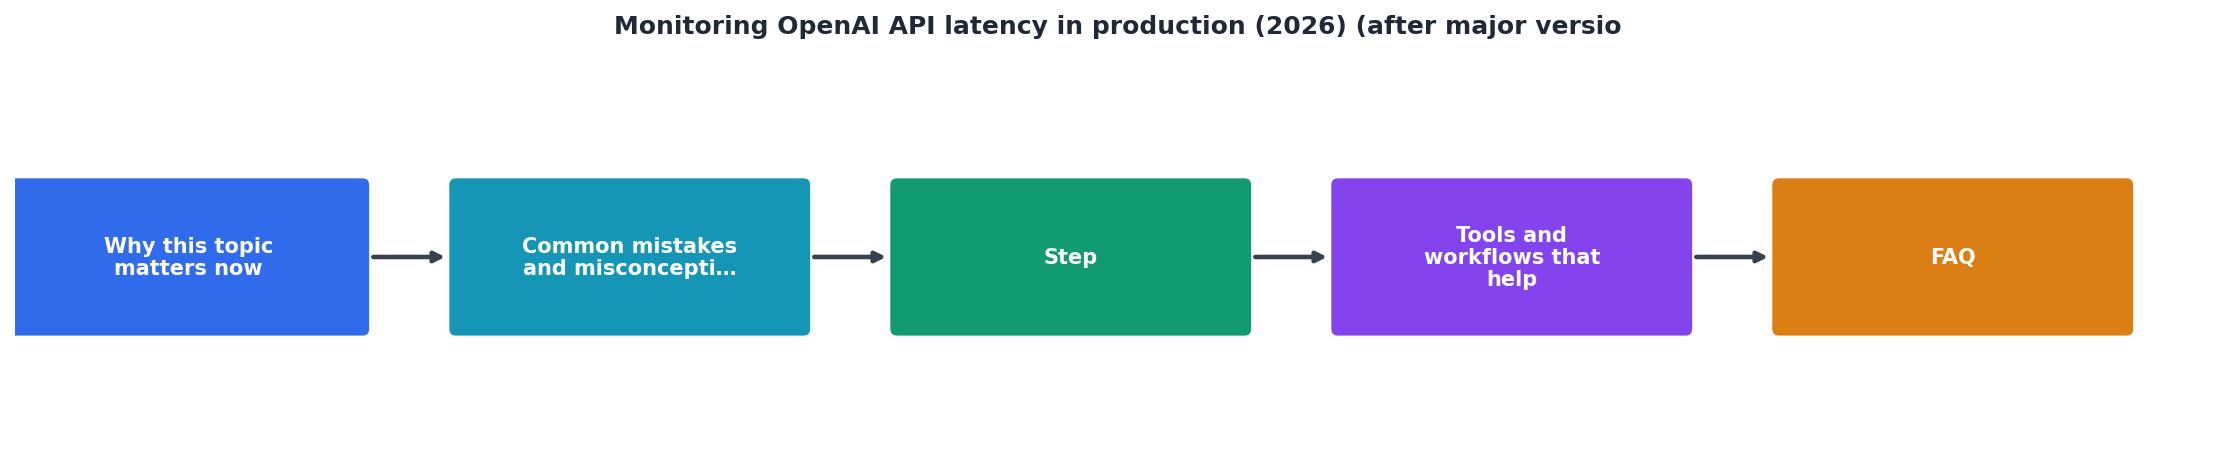
You cannot measure regression without a reference point. Here is a step-by-step process for establishing a reliable baseline before any announced model upgrade:
Step-by-step: baseline capture workflow
- Identify the upgrade window. Subscribe to the OpenAI status page and changelog. Major model releases are typically announced days to weeks in advance.
- Lock your probe configuration. Ensure your synthetic probes use a fixed prompt, fixed
max_tokens, and fixedtemperatureso that results are comparable across time. Changing any parameter invalidates the comparison.
- Run probes from every relevant region for at least 7 days. Seven days captures weekday/weekend traffic patterns on the provider side. If you use Observinio, the daily probes from 21 regions handle this automatically, just make sure your account is active before the window opens.
- Record p50, p95, and p99 for TTFB and TTFT per region. Store these as your baseline snapshot. Observinio's weekly summary emails include exactly these percentiles, which you can archive for comparison.
- Tag the baseline in your monitoring system. Whether you use Observinio's built-in comparison view or export data to your own warehouse, label the baseline period clearly (e.g.,
pre-gpt5-upgrade-2026-08).
Regional variance: the hidden risk after upgrades

One of the most common failure modes after a major version upgrade is asymmetric regional regression. The global median looks fine because North America, where most traffic originates, is well-served. Meanwhile, Asia-Pacific or South America sees degraded performance because capacity was temporarily reallocated.
Regions to watch closely
- EU West (Frankfurt, London, Paris): GDPR-sensitive workloads often route here. Any latency spike affects compliance-critical applications.
- AP Southeast (Singapore, Sydney, Mumbai): High growth region for AI-powered products. Historically underserved by US-centric providers.
- SA East (São Paulo): Often the last region to receive capacity upgrades. Tail latency here can be 3–5× the US baseline after a major release.
- US East vs US West: Even within the US, coast-to-coast variance can be meaningful. If OpenAI shifts primary inference to a new data center, one coast may benefit while the other regresses.
Practical checklist: surviving the next major upgrade
Use this checklist every time OpenAI announces a major model version change:
Your progress is saved automatically in your browser.
"The keyboard now opens automatically after you attach a file, helping you continue your message seamlessly.">, ChatGPT, Release Notes
This kind of incremental UX improvement on the provider side is a reminder that changes, large and small, ship continuously. Your monitoring must be equally continuous.
Comparing OpenAI direct vs OpenRouter after upgrades
Many teams route through OpenRouter for model flexibility and fallback logic. After a major OpenAI upgrade, it is worth comparing latency through both paths:
- OpenAI direct endpoint: Gives you the raw provider latency without intermediary overhead.
- OpenRouter endpoint: Adds a routing layer that may introduce 10–50 ms of overhead but provides fallback and load-balancing benefits.
| Dimension | OpenAI Direct | OpenRouter |
|---|---|---|
| Typical added latency | 0 ms (baseline) | 10–50 ms routing overhead |
| Automatic failover | No | Yes |
| Post-upgrade adaptation | Immediate (same provider) | May lag until routing tables update |
| Best for | Lowest-latency single-provider setups | Multi-model fallback architectures |
After an upgrade, the delta between these two paths can change. If OpenRouter's caching or routing logic has not yet adapted to the new model's characteristics, you may see a temporary increase in the overhead. Conversely, OpenRouter may route around a degraded OpenAI region faster than your own application logic can.
Observinio monitors both OpenRouter and OpenAI direct endpoints, so you can compare these paths side by side on the status page without running your own dual-probe infrastructure.
Automating the comparison with Observinio
Rather than manually pulling metrics and building spreadsheets after every upgrade, you can lean on Observinio's built-in workflow:
- Daily probes run automatically from 21 regions against both OpenAI and OpenRouter endpoints.
- Baseline comparison is computed against historical data, no manual tagging required for standard monitoring.
- Degradation alerts fire when any region's latency exceeds the configured threshold relative to its baseline.
- Weekly summary emails land in your inbox every Monday with percentile breakdowns by region, giving you a ready-made before/after comparison.
Frequently Asked Questions
If you want to stop guessing whether the next OpenAI upgrade will break your latency targets, set up multi-region monitoring before the release lands. Observinio's degradation alerts and status page give you the early warning system your on-call team needs, no custom infrastructure required.
Additional Resources
- GPT-5.6: Frontier intelligence that scales with your ambition - Update on August 21, 2026: OpenAI dropped the API and credit pricing ... We simulate latency at fast API speeds, and cost at regular API pricing.
- ChatGPT — Release Notes - This update does not affect the API or Codex. better tracks evolving user intent, calibrates tone, and avoids repetitive or overly structured responses. ...
- Five Models in Three Months — The GPT-5.x Timeline and ... - The API version your production system calls stops responding after a given date. Deprecated API calls return 410 Gone — hard failure, not a degraded service.