
Photo by Andrew Neel from Pexels
Design operations teams increasingly depend on OpenAI-powered features, from automated asset generation and copy suggestions to real-time design critique bots embedded in Figma plugins. When the API behind those features slows down, the entire creative pipeline stalls: designers wait, review cycles stretch, and sprint commitments slip. Monitoring that latency in production is no longer optional; it is a core design-ops responsibility in 2026.
This guide walks you through the metrics that matter, the regional pitfalls that catch teams off guard, and a concrete monitoring setup you can roll out this week, even without a dedicated platform engineering team.
TL;DR
- OpenAI API latency in production varies dramatically by region, model, and time of day, aggregate averages hide the pain your designers actually feel.
- Time to First Token (TTFT) is the metric that most directly impacts perceived responsiveness in design tooling.
- Synthetic probes from multiple regions give you a baseline before users report problems.
- Alerting on deviation from that baseline, not on a fixed threshold, catches degradation earlier.
- Observinio runs daily probes from 21 regions and sends email alerts when latency drifts, so you can act before your design team even notices.
Why design ops needs latency monitoring now
Design operations has evolved far beyond file naming conventions and handoff checklists. In 2026, a typical design-ops stack includes at least one AI-powered step: generating placeholder copy with GPT-4o, running accessibility audits through a completion endpoint, or producing image variations via the DALL·E API. Each of those steps makes a synchronous or near-synchronous call to OpenAI.
When that call takes 800 ms instead of the usual 250 ms, the impact compounds. A designer running ten iterations in a morning loses minutes. A Figma plugin that feels "laggy" gets abandoned in favor of manual work, erasing the productivity gain the tool was supposed to deliver. Worse, intermittent slowdowns are hard to reproduce: by the time someone files a ticket, the spike is over and the dashboard shows a healthy average.
The root cause is almost never your own infrastructure. It is the provider, and the specific region your request lands in. Without external, multi-region monitoring, you are flying blind.
The metrics that matter for design-ops workflows

Not every latency number is equally useful. Here are the four you should track, ranked by relevance to design-ops use cases:
- Time to First Token (TTFT), The interval between sending the request and receiving the first streamed token. This is what determines perceived speed in any interactive tool. A Figma plugin that streams copy suggestions feels fast at 150 ms TTFT and sluggish at 600 ms, regardless of total generation time.
- Time to First Byte (TTFB), The network-level equivalent: how long until the first byte of the HTTP response arrives. TTFB includes DNS resolution, TLS handshake, and server processing. It is a useful proxy when you cannot instrument token-level streaming.
- End-to-end completion time, Total wall-clock time from request sent to last token received. Important for batch workflows like generating alt-text for an entire asset library overnight.
- Regional variance, The delta between the fastest and slowest region for the same model and prompt. A 3× spread between
us-east-1andap-southeast-1is not unusual, and it directly affects globally distributed design teams.
"Intuition: Prompt tokens add very little latency to completion calls.">, Production best practices
This means your monitoring should focus on output token generation and network path, not on prompt size. A 2,000-token system prompt for your design-critique bot adds negligible latency compared to the model's generation phase and the network round trip from your designer's region.
A quick metric-selection checklist for design ops
Your progress is saved automatically in your browser.
Understanding regional latency variance
Design teams are rarely co-located. A product company might have designers in London, São Paulo, and Singapore, all hitting the same OpenAI endpoint. The latency each designer experiences depends on the network path from their region to the nearest OpenAI inference cluster, current load on that cluster, and any intermediary routing (CDN, API gateway, OpenRouter).
Observinio's daily probes from 21 global regions consistently show that the gap between the best and worst region for a given model can exceed 400 ms on TTFT alone. That gap is not static: it shifts with provider capacity changes, model updates, and traffic patterns tied to business hours across time zones.
For design ops, this means a tool that feels snappy for your New York team might feel broken for your Singapore team, and neither side is wrong. Without per-region data, you will waste cycles debugging your own infrastructure when the issue is entirely on the provider side.
Key regions to watch
- US East / US West, Typically the lowest latency for OpenAI direct endpoints.
- Western Europe (Frankfurt, London), Usually within 50–100 ms of US East, but spikes during European business hours.
- Asia-Pacific (Tokyo, Singapore, Sydney), Highest variance; often the first to degrade during global capacity crunches.
- South America (São Paulo), Frequently overlooked; latency can be 2–3× US East baseline.
Setting up production-grade monitoring: step by step
You do not need to build a custom observability stack. The following steps get you from zero to actionable alerts in under an hour.
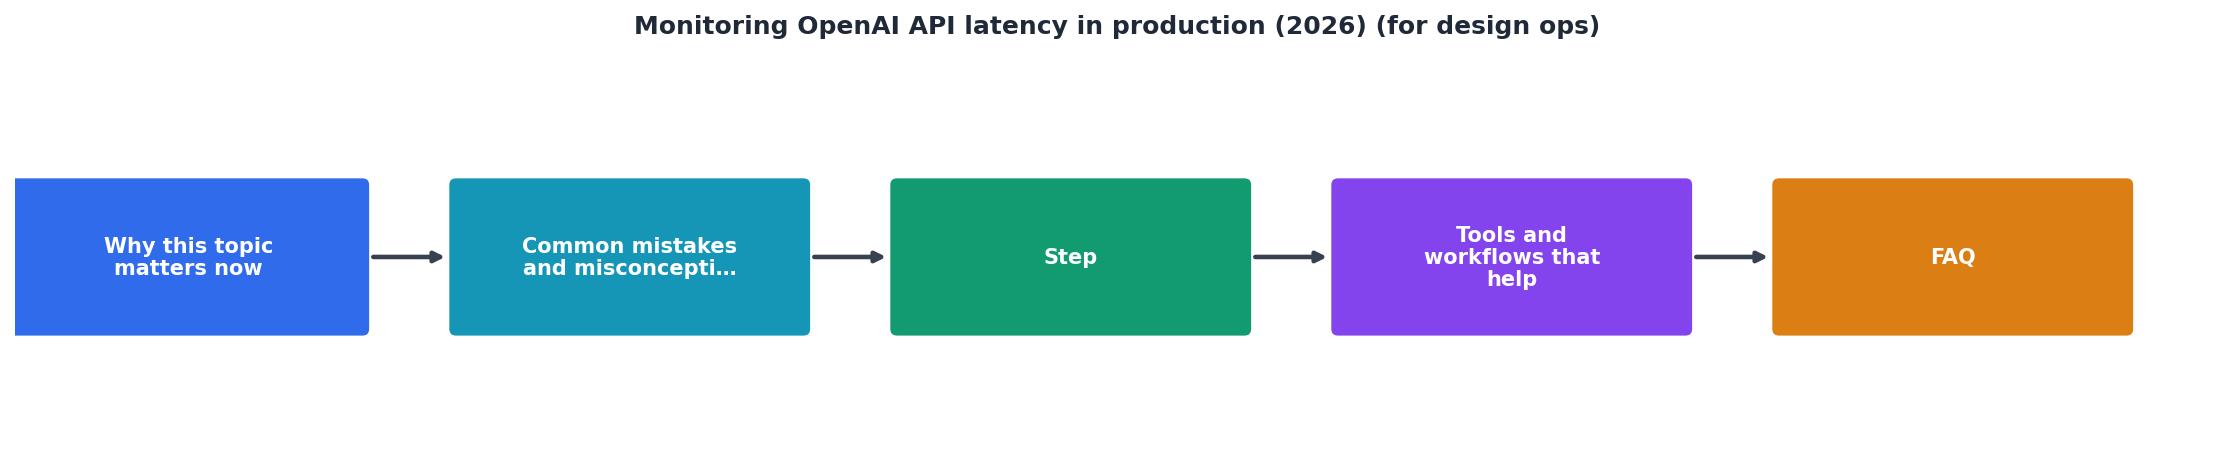
- Inventory your API calls. List every OpenAI model and endpoint your design tools use. Include both direct OpenAI calls and any that route through OpenRouter. Note the expected response size (token count) for each use case.
- Establish a baseline. Before you can alert on degradation, you need to know what "normal" looks like. Use Observinio's status page to review historical TTFT and TTFB data for your models across the regions your team operates in. Record the p50 and p95 values for each region-model pair.
- Configure synthetic probes. Synthetic probes send a standardized request to the API at regular intervals from multiple regions, independent of real user traffic. Observinio runs these daily from 21 regions automatically. If you need custom probe prompts that mimic your design-tool payloads, you can configure them via the dashboard.
- Set deviation-based alerts. Fixed thresholds (e.g., "alert if TTFT > 500 ms") are brittle, they fire too often in high-latency regions and too late in low-latency ones. Instead, alert when latency exceeds your established baseline by a percentage (e.g., 40% above p50 for that region). Observinio's email alerts support this baseline-comparison approach out of the box.
- Route alerts to the right people. Design-ops leads need to know when tools will feel slow. SREs need to know when to investigate. Set up two alert channels: a low-urgency email digest for design ops (weekly summary) and an immediate alert for the on-call engineer when p95 crosses the degradation threshold.
- Review weekly summaries. Observinio sends weekly latency trend reports that show whether each region-model pair is stable, improving, or degrading. Use these in your design-ops standup to proactively communicate tool performance to the design team.
Example: instrumenting a Figma plugin's OpenAI calls
If your Figma plugin calls OpenAI for copy suggestions, add lightweight client-side timing around the fetch call:
const start = performance.now();
const response = await fetch("https://api.openai.com/v1/chat/completions", {
  method: "POST",
  headers: {
    "Authorization": Bearer ${apiKey},
    "Content-Type": "application/json"
  },
  body: JSON.stringify({
    model: "gpt-4o-mini",
    messages: [{ role: "user", content: prompt }],
    stream: true
  })
});
const ttfb = performance.now() - start;
console.log(TTFB: ${ttfb.toFixed(0)} ms);

// Read the first chunk for TTFT
const reader = response.body.getReader();
const firstChunk = await reader.read();
const ttft = performance.now() - start;
console.log(TTFT: ${ttft.toFixed(0)} ms);
This gives you real-user TTFB and TTFT data from the designer's actual location. Combine it with Observinio's synthetic probes to distinguish between "the API is slow globally" and "this designer's network is the bottleneck."
Interpreting the data and acting on it
Raw latency numbers are only useful if they drive decisions. Here is how to translate monitoring data into design-ops actions:
- Sustained regional degradation (> 24 hours). If TTFT in a specific region stays elevated for more than a day, consider routing that region's traffic through a different provider or switching to a smaller, faster model for interactive use cases. Check Observinio's provider comparison page for current alternatives.
- Spikes correlated with business hours. If latency consistently rises during 9 AM–12 PM in a given time zone, pre-generate assets during off-peak hours. Batch workflows like alt-text generation or design-token descriptions can be scheduled overnight.
- Model update regressions. OpenAI periodically updates model weights and infrastructure. After any announced model update, compare the new baseline against the previous week's data. Observinio's weekly summaries make this comparison straightforward.
- TTFT vs. total time divergence. If TTFT stays stable but total completion time increases, the model is generating more tokens per request, possibly due to a prompt change on your side. Review recent prompt template updates in your design tools.
Decision matrix for design-ops leads
| Signal | Likely cause | Recommended action |
|---|---|---|
| TTFT up 50%+ in one region | Provider capacity issue | Notify affected designers; monitor for recovery |
| TTFT up 50%+ in all regions | Global provider degradation | Switch to fallback model; file support ticket |
| TTFB up but TTFT stable | Network/routing change | Check DNS, CDN, or OpenRouter routing config |
| Total time up, TTFT stable | Longer model output | Audit recent prompt template changes |
| Intermittent spikes (< 1 hr) | Transient load | No action; verify via next probe cycle |
Common pitfalls to avoid
- Monitoring only from one region. If your probes run exclusively from US East, you will never catch the degradation your Asia-Pacific designers experience daily.
- Using fixed thresholds everywhere. A 300 ms TTFT threshold that works for US West will generate constant false alarms for São Paulo.
- Ignoring streaming vs. non-streaming differences. A non-streaming completion that returns in 2 seconds might feel slower than a streaming one with 200 ms TTFT, even if total time is identical. Monitor the metric that matches your UX.
- Treating all models the same.
gpt-4oandgpt-4o-minihave fundamentally different latency profiles. Monitor each model separately. - Forgetting to re-baseline after model updates. Provider-side changes can shift your baseline overnight. Re-establish baselines quarterly or after any major model announcement.
Frequently Asked Questions
Start monitoring before your designers start complaining
If your design-ops workflows depend on OpenAI API calls, and in 2026, they almost certainly do, latency monitoring is not a nice-to-have. Observinio gives you daily multi-region probes, baseline comparisons, and email alerts without requiring you to build or maintain any infrastructure. Visit the Observinio status page to see current latency data across 21 regions, or get in touch to set up degradation alerts tailored to your team's models and regions.
Ready to monitor OpenAI latency across 21 regions?
Observinio delivers daily multi-region probes, baseline comparisons, and email alerts with zero infrastructure to maintain.
View live status dashboard Set up alerts for your teamAdditional Resources
- Production best practices | OpenAI API - API key usage can be monitored on the Usage page once tracking is enabled. You can enable tracking going forward on the API key management dashboard.
- How to Create Latency Monitoring - This guide walks through building comprehensive latency monitoring for LLM operations, from capturing Time to First Byte (TTFB) through ...
- AI Monitoring in Production 2026: LLM Observability & Drift Detection - The definitive 2026 guide to AI monitoring in production, covering LLM observability stacks, hallucination and drift detection, and SLO design for production AI systems.