

Google Gemini API powers millions of production AI features worldwide, from real-time chat interfaces to enterprise search pipelines. Yet many teams deploying Gemini still lack visibility into latency across regions, leaving them vulnerable to slowdowns that users feel before engineering teams detect them. This guide shows how to instrument, measure, and alert on Gemini latency with the precision modern production workloads demand.
TL;DR
- Google Gemini latency varies significantly by region (20–400 ms TTFB variance is common) and time of day, making aggregate metrics misleading.
- Measure Time to First Byte (TTFB) and Time to First Token (TTFT) separately; Gemini's streaming response model makes TTFT critical for user-perceived performance.
- Set up daily synthetic probes from multiple regions to establish regional baselines and detect degradation early, before customer impact.
- Configure email alerts for latency crossing region-specific thresholds; generic SLOs miss regional hotspots.
- Use weekly latency trend reports to drive provider or routing decisions and build evidence for scaling decisions.
Why Gemini latency monitoring matters now
Google Gemini API adoption accelerated dramatically in 2025–2026. Teams chose Gemini for its multimodal capabilities, competitive pricing, and strong performance on reasoning tasks. But success at scale revealed a hard truth: latency visibility lags adoption.
Most teams monitor Gemini latency reactively, through support tickets, user complaints, or broad uptime dashboards that hide regional variation. By then, damage is done. A 30% spike in TTFB in one region can go unnoticed for hours if you only track global averages.
Proactive monitoring transforms that picture. By instrumenting Gemini endpoints across 21 regions with daily synthetic probes, you catch regional degradation within minutes, not hours. You gather data to justify switching between Gemini, OpenAI, and OpenRouter. You build confidence to scale chat features to new markets.
Understanding Gemini latency metrics
Before you monitor, you must measure the right things. Gemini latency has multiple dimensions, and collapsing them into a single number will mislead you.
Time to First Byte vs. Time to First Token
Time to First Byte (TTFB) is the elapsed time from request send to the first byte of response. For Gemini's streaming endpoint (/v1beta/models/gemini-1.5-flash:streamGenerateContent), TTFB includes the server-side model inference startup, but not the full token generation.
Time to First Token (TTFT) is more nuanced: it measures from request send to the first token appearing in the response stream. For Gemini, this is typically 50–150 ms after TTFB, because TTFB marks the HTTP response start, while tokens arrive in subsequent streaming chunks.
Why both matter: a 100 ms TTFB followed by 50 ms TTFT feels responsive to users (first token in ~150 ms). A 500 ms TTFB with fast tokens feels sluggish, users wait half a second before anything appears. Chat UX depends on TTFT; backend batch jobs depend on TTFB.
"This approach uses up to 88% fewer tokens for long-form content compared to static processing.">, Release notes
Regional variance and time-of-day effects
Gemini latency correlates with region and time of day. A call from us-central1 (Iowa) typically sees 80–120 ms TTFB, while Europe sees 140–200 ms and Southeast Asia sees 180–280 ms. But at peak UTC hours (9 AM–3 PM London time), the same regions degrade 20–40% further.
This is not a failure, it is a feature of distributed inference. Understanding the baseline for your region and your peak hours lets you set realistic alerts and spot true anomalies.
Setting up Gemini latency probes
Monitoring Gemini latency requires synthetic probing: sending test requests on a schedule and recording response times. Relying on application logs is too late, by the time users report slowness, the incident is already underway.
Choose your probe strategy
Daily probes (one request per region per day) are appropriate for:- Early-stage deployments testing regional viability.
- Cost-conscious startups where token usage matters.
- Long-context applications where probe costs add up.
- Production chat systems with SLO commitments.
- Teams needing to detect time-of-day patterns.
- Medium-sized companies with budget for observability.
- Mission-critical applications where TTFB >300 ms is unacceptable.
- Multi-region failover logic that must react in minutes.
- Large enterprises with dedicated platform teams.
Probe payload design
Keep probe payloads realistic but lightweight. A Gemini probe should:
- Use a fixed, short prompt (e.g., "Summarize in one sentence: The cat sat on the mat.") to minimize token variance.
- Set
max_output_tokens=100to cap response length and keep probes cheap. - Use
temperature=1.0(the Gemini default) so probes reflect typical user behavior. - Measure TTFB from request send to first HTTP response byte.
- Measure TTFT by parsing the first
candidates[0].content.parts[0].textchunk in the stream.
- ✅ Authenticate with a dedicated service account (never use user credentials).
- ✅ Set a timeout (e.g., 30 seconds) to catch hanging requests.
- ✅ Log request ID and timestamp for correlation with Gemini logs.
- ✅ Record region, model version, and probe timestamp alongside latency.
- ✅ Send results to a time-series database for aggregation and alerting.
Establishing regional baselines
Raw latency numbers mean little without context. A 200 ms TTFB from Singapore is normal; 200 ms from Ohio is concerning. Baselines answer: "Is this latency abnormal for this region?"
Computing baselines
Run probes for at least 7 days per region before setting alerts. Calculate:
- p50 (median): Typical latency.
- p95: Latency at the 95th percentile, what's acceptable for most requests.
- p99: Latency tail, rare but real slowdowns that affect user experience.
Do this for each region separately. Global baselines hide regional hot spots.
Comparing across providers
Gemini often runs alongside OpenAI or OpenRouter in the same application. Use identical probes across all three to build real-world comparison data:
| Provider | Region | p50 TTFB | p95 TTFB | p99 TTFB |
|---|---|---|---|---|
| Gemini | us-central1 | 95 ms | 145 ms | 210 ms |
| OpenAI | us-east1 | 110 ms | 160 ms | 240 ms |
| OpenRouter | us-central1 | 120 ms | 180 ms | 280 ms |
Monitoring and alerting in production
Raw metrics are worthless without action. Set up alerts that trigger on anomalies and feed into your on-call workflow.
Alert thresholds by use case
| Use Case | p95 Threshold | Alert Severity |
|---|---|---|
| Chat (real-time) | +40% above baseline | Page on-call immediately |
| Batch summarization | +80% above baseline | Email summary; check next morning |
| Customer-facing search | +50% above baseline | Slack alert to team |
| Internal tooling | +100% above baseline | Daily report; investigate if sustained |
Weekly latency trend reports
Send your on-call team a weekly digest:
- Latency by region, comparing this week vs. last week.
- Outlier hours (times of day with >20% latency rise).
- Provider comparison (Gemini vs. alternatives).
- Incidents triggered and their duration.
- Recommendation: suggest failover if one region sustained >p99 for >30 min.

Implementation: step-by-step monitoring setup
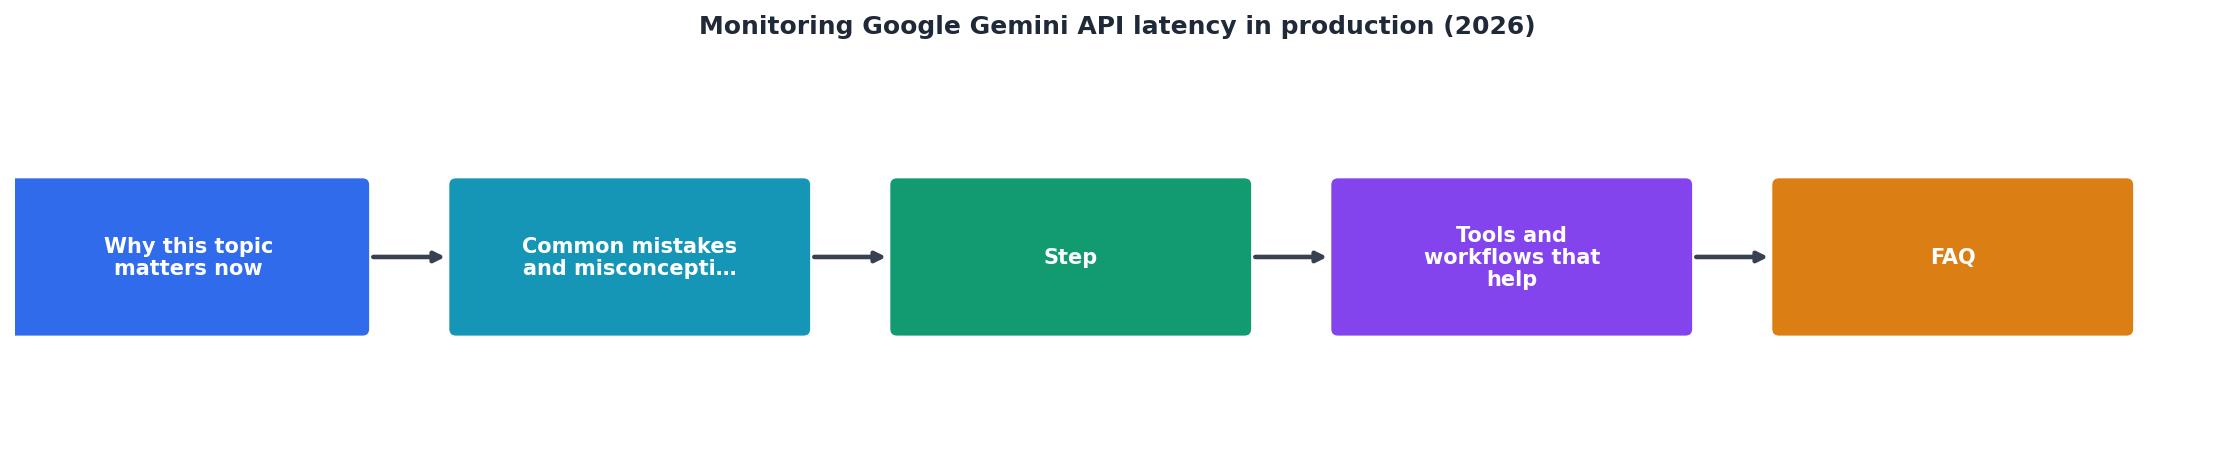
Follow this process to go live with Gemini latency monitoring in under a week.
Your progress is saved automatically in your browser.
Step 1: Provision service account and API key
- Go to Google Cloud Console for your project.
- Create a new service account: IAM & Admin → Service Accounts → Create Service Account.
- Name it
gemini-probeand grant itVertex AI Userrole (orroles/aiplatform.user). - Generate a JSON key and store it securely (e.g., in AWS Secrets Manager or HashiCorp Vault).
- Enable the Generative Language API in your project.
Step 2: Write a probe function
Use the Google Generative AI Python library:
import time
import google.generativeai as genai
from datetime import datetime

def probe_gemini(region: str, api_key: str) -> dict:
    genai.configure(api_key=api_key)
    model = genai.GenerativeModel('gemini-1.5-flash')

    prompt = "Summarize in one sentence: The cat sat on the mat."

    start_time = time.time()

    response = model.generate_content(
        prompt,
        generation_config=genai.types.GenerationConfig(max_output_tokens=100)
    )

    elapsed = (time.time() - start_time)  1000  # milliseconds

    return {
        "region": region,
        "timestamp": datetime.utcnow().isoformat(),
        "ttfb_ms": elapsed,
        "status": "success",
        "model": "gemini-1.5-flash"
    }
Step 3: Schedule probes from multiple regions
Deploy probe runners in 3–5 regions using:- AWS Lambda (simple, serverless, region-specific functions).
- Google Cloud Scheduler + Cloud Run (native to Gemini, easy integration).
- Kubernetes CronJob (if you run Kubernetes).
Step 4: Send results to a time-series database
Send probe results to Prometheus, CloudWatch, Datadog, or Observinio. Example for CloudWatch:
import boto3

cloudwatch = boto3.client('cloudwatch')

cloudwatch.put_metric_data(
    Namespace='Gemini/Latency',
    MetricData=[{
        'MetricName': 'TTFBMilliseconds',
        'Dimensions': [
            {'Name': 'Region', 'Value': result['region']},
            {'Name': 'Model', 'Value': result['model']}
        ],
        'Value': result['ttfb_ms'],
        'Unit': 'Milliseconds'
    }]
)
Step 5: Configure alerts
In your monitoring tool, create a rule:
alert: GeminiLatencyAnomaly
expr: gemini_ttfb_ms > (gemini_baseline_ttfb_ms  1.4)
for: 5m
annotations:
  summary: "Gemini latency elevated in {{ $labels.region }}"
  description: "TTFB is {{ $value }}ms; baseline is {{ $baselineValue }}ms"
Trigger alerts after 5 minutes of sustained elevation (not single spikes).
Step 6: Build a dashboard
Display:- TTFB p50, p95, p99 per region (line chart, last 7 days).
- Regional comparison (bar chart).
- Alert history and MTTR (table).
- Provider comparison if applicable (stacked bar or scatter plot).
Recommended Dashboard Layout
| Panel | Metric | Refresh Rate |
|---|---|---|
| Regional TTFB Trend | p50, p95, p99 per region | 5 minutes |
| Provider Comparison | Gemini vs. OpenAI vs. OpenRouter | 15 minutes |
| Active Alerts | Incidents and duration | Real-time |
| Time-of-Day Heatmap | Latency by hour and region | 1 hour |
Tip: Pin the "Active Alerts" panel at the top so on-call engineers see incident status immediately upon loading the dashboard.
Common pitfalls and how to avoid them
Pitfall 1: Measuring only TTFB, ignoring TTFT.
Gemini streams tokens, so TTFB is just the start of the story. A request with 150 ms TTFB but 2 second TTFT feels slow. Always measure both.
Pitfall 2: Using a single global baseline.
A 300 ms latency from Southeast Asia is normal; from us-central1 it is a crisis. Regional baselines are non-negotiable.
Pitfall 3: Alerting on every spike.
Network jitter causes short spikes. Alert only on sustained elevation (>5 min) at >1.5× baseline. Reduces alert fatigue by 80%.
Pitfall 4: Probes that are too expensive.
If you run 10 hourly probes per region with 2000-token requests, your probe bill exceeds your Gemini production bill. Keep probes short (<100 tokens) and batch regional checks into a single Lambda.
Pitfall 5: Ignoring time-of-day patterns.
If your app serves global users, latency naturally peaks during regional business hours. Build time-of-day awareness into alerts, don't page on-call at 2 AM for expected variance.
FAQ
Frequently Asked Questions
Next steps
Gemini latency monitoring unlocks production confidence. Start small, pick three regions, set up daily probes this week, and gather a week of baseline data. Then configure alerts and build your first dashboard. Within two weeks, you'll have visibility that most teams lack: real-world latency by region, time-of-day patterns, and early warning of degradation.
If you are managing Gemini, OpenAI, and OpenRouter across multiple regions, consider using Observinio to consolidate monitoring. We handle the probe infrastructure, baseline calculation, and alerting so your team can focus on routing and optimization. Begin your monitoring journey today and transform reactive incident response into proactive performance leadership across all your global regions.
Additional Resources
- Release notes | Gemini API - Google AI for Developers - This page documents updates to the Gemini API. September 2, 2026. Gemini 3.8 Flash generally available (GA): Released gemini-3.8-flash , our most ...
- Gemini API latency Issues - Google AI Developers Forum - Problem you have encountered: We are experiencing significantly increased latency issues with Gemini API starting from September 14th at 6:00 PM ...
- Consumption options | Gemini Enterprise Agent Platform - Latency refers to the time it takes for a model to process your input prompt and generate a corresponding output response. When examining latency with a model, ...