
Photo by Andrew Neel from Pexels
Enterprise teams shipping LLM-powered features in 2026 face a familiar but intensifying problem: OpenAI API latency is not a single number. It shifts by region, by model, by time of day, and by load patterns that are entirely outside your control. If your monitoring strategy still relies on aggregate P50 dashboards or manual spot checks, you are flying blind in production.
This guide walks through the metrics that matter, the architecture for continuous multi-region probing, and the operational playbooks that keep enterprise chat, search, and agent features within their latency SLOs.
TL;DR
- OpenAI API latency varies dramatically across regions, a 200 ms gap between US-East and Southeast Asia is common, not exceptional.
- Enterprise teams need to track Time to First Byte (TTFB), Time to First Token (TTFT), and total completion time as separate signals.
- Synthetic probes running from multiple regions on a fixed schedule are the only reliable way to establish baselines and detect degradation before users notice.
- Alerting should be threshold-based against your own historical baselines, not against provider-published SLAs.
- Weekly latency trend reports give leadership and product teams the data they need for routing and provider decisions.
Why aggregate latency metrics fail enterprise teams
Most APM tools report a single latency number for your OpenAI integration, typically the P50 or P95 of the round-trip time measured from your own backend. That number hides at least three critical dimensions:
- Regional variance. A request originating from your
us-east-1backend hits OpenAI's US endpoints quickly, but the same model served to a user in Frankfurt or Singapore adds network hops, potential routing through different Azure regions, and sometimes entirely different inference clusters. - Streaming vs. non-streaming. Enterprise chat features almost always use streaming completions. The metric that matters for perceived speed is TTFT, the time until the first token arrives, not the total completion time. A response that takes 4 seconds total but starts streaming at 350 ms feels fast. A response that takes 2 seconds total but blocks for 1.8 seconds before the first token feels broken.
- Model-specific behavior. GPT-4o, GPT-4.1, and o3-mini each have different inference profiles. Switching models without re-baselining your latency expectations leads to false alerts or, worse, missed degradation.
The three metrics every enterprise team must track
Before building a monitoring pipeline, align your team on exactly which latency signals matter. Here is the hierarchy:
1. Time to First Byte (TTFB)
TTFB measures the interval from the moment your HTTP request leaves your backend to the moment the first byte of the response arrives. This captures DNS resolution, TLS handshake, network transit, and the provider's initial processing overhead. For non-streaming endpoints, TTFB is your primary responsiveness signal.
2. Time to First Token (TTFT)
For streaming completions, TTFT is the interval from request dispatch to the arrival of the first content token in the SSE stream. This is the metric your users actually feel, it determines how long they stare at a blank chat bubble. Enterprise SLOs for interactive features should be defined in terms of TTFT, not total duration.
3. Total completion time
The wall-clock time from request to the final token (or the complete non-streaming response). This matters for batch workloads, agent chains, and any pipeline where downstream steps block on the full output. It also serves as a capacity signal: rising total completion times at constant prompt lengths suggest inference cluster congestion on the provider side.
Track all three independently, broken down by model, by region, and by hour of day. Anything less and you are averaging away the signals that actually predict user-facing impact.
| Metric | Best for | Typical P95 target |
|---|---|---|
| TTFB | Non-streaming endpoints, network health | 300–500 ms |
| TTFT | Streaming chat, perceived responsiveness | 400–600 ms |
| Total completion time | Batch pipelines, agent chains | 2–5 s |
Architecting multi-region synthetic probes

Relying on production traffic to measure latency introduces survivorship bias, you only see latency for requests that actually happened, from regions where you already have users. Synthetic probes solve this by generating controlled requests on a fixed schedule from known locations.
A robust enterprise probe architecture includes:
- Geographically distributed probe origins. You need probes in every region where you have users or plan to expand. A minimum viable set for a global product covers North America (East and West), Europe (West and Central), and Asia-Pacific (Tokyo, Singapore, Sydney). Ideally, you cover 15–21 regions to capture edge cases like South America, the Middle East, and South Africa.
- Standardized test payloads. Each probe sends the same prompt with the same parameters (model, max tokens, temperature) so that latency differences reflect infrastructure, not workload variation. Keep the prompt short, 50–100 tokens of input, requesting 50–100 tokens of output, to isolate network and inference startup time from generation throughput.
- Fixed probe intervals. Daily probes at the same time establish a clean baseline. More frequent probes (every 15–30 minutes) catch transient degradation but cost more in API credits. For most enterprise teams, a combination of daily baseline probes and event-triggered probes (after deployments or provider announcements) strikes the right balance.
- Separate tracking for direct and routed endpoints. If you use OpenRouter or a similar routing layer alongside direct OpenAI access, probe both paths independently. The routing layer adds its own latency and failure modes.
"The following diagram illustrates the monitoring of Azure OpenAI instances without a gateway.">, Implement Advanced Monitoring for Foundry Models Through a Gateway
Observinio runs exactly this kind of architecture: daily probes from 21 global regions against both OpenAI direct and OpenRouter endpoints, tracking TTFB and TTFT per model. The data feeds into baseline comparisons and degradation alerts without requiring you to build or maintain the probe infrastructure yourself.
Step-by-step: setting up production latency monitoring
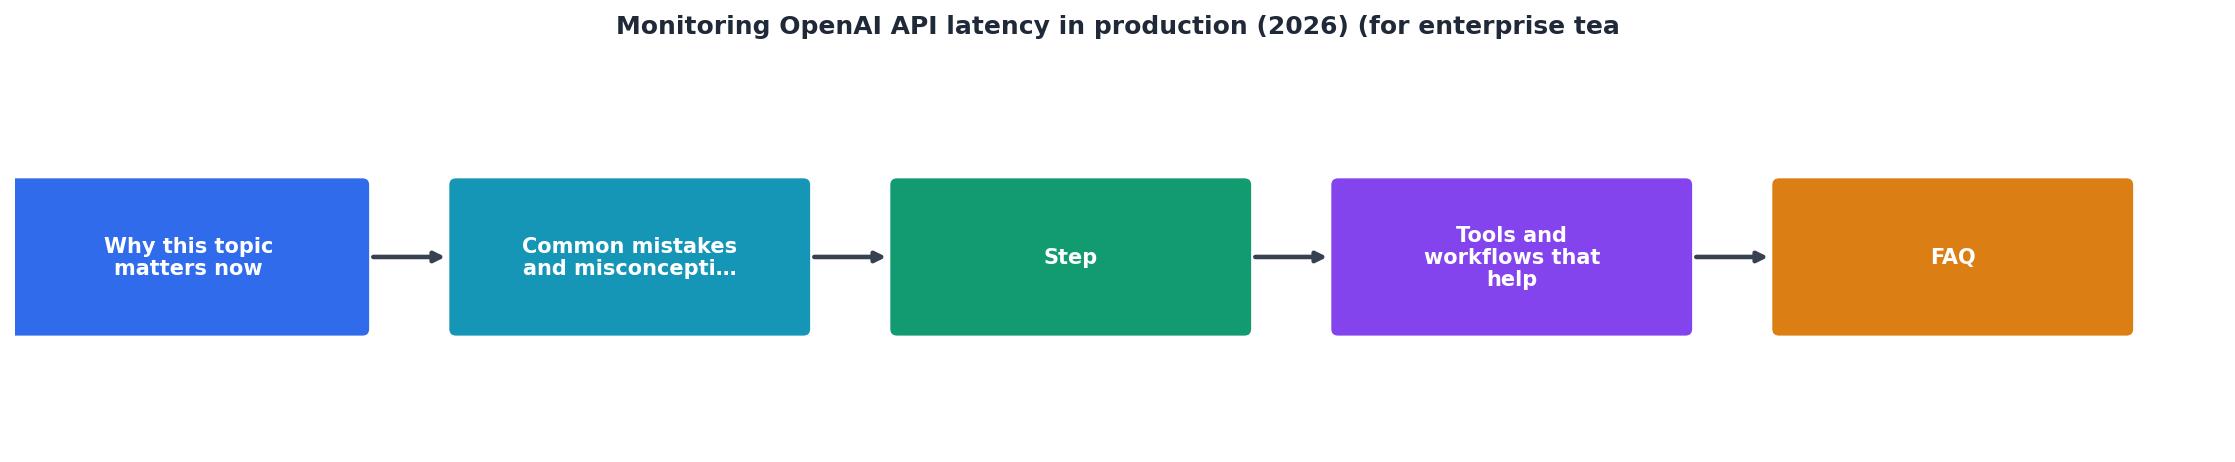
Follow these steps to go from zero visibility to actionable latency monitoring in a production environment:
- Inventory your models and endpoints. List every OpenAI model your product calls in production, including version pins. Note whether each call is streaming or non-streaming, and which backend regions originate the requests.
- Define SLOs per feature. Interactive chat might require TTFT under 500 ms at P95. A background summarization pipeline might tolerate 5 seconds of total completion time. Write these down, they become your alert thresholds.
- Deploy synthetic probes. Either build a lightweight probe service (a cron job in each region that calls the API and logs timestamps) or use a managed service like Observinio that already covers 21 regions. The key requirement is that probes run on a consistent schedule with identical payloads.
- Establish baselines. Run probes for at least two weeks before setting alert thresholds. Latency has weekly patterns (weekday peaks, weekend troughs) and you need a full cycle to set meaningful thresholds. Calculate P50, P95, and P99 per region per model.
- Configure degradation alerts. Set alerts when a region's P95 exceeds its baseline by more than 30 % for two consecutive probe cycles. This avoids single-spike false positives while catching sustained degradation. Route alerts to your on-call channel (Slack, PagerDuty, email).
- Build a weekly summary report. Aggregate the week's probe data into a report showing: regions with the lowest and highest TTFT, week-over-week trend direction, and any SLO breaches. Distribute this to engineering leadership and product managers. Observinio generates these weekly summaries automatically via email.
- Review and adjust quarterly. Models change, regions shift, and your product's traffic patterns evolve. Re-baseline every quarter or after any major model migration.
Handling regional latency variance at scale

Regional variance is not a bug, it is a structural feature of how large-model inference is deployed. OpenAI's inference clusters are concentrated in specific Azure regions, and requests from distant origins pay a network tax. Enterprise teams with global user bases need strategies beyond simple monitoring:
- Latency-aware routing. If your architecture supports it, route user requests to the backend region closest to the inference cluster with the lowest current latency. This requires real-time latency data from your probes, not static configuration.
- Provider failover. When a specific region degrades past your SLO threshold, automatically fail over to an alternative provider or model that meets the latency requirement. This is where tracking both OpenAI direct and OpenRouter latency pays off, you have a ready fallback path with known performance characteristics.
- Edge caching for repeated queries. Some enterprise workloads (FAQ bots, template-based generation) produce identical outputs for identical inputs. Caching at the edge eliminates API latency entirely for cache hits.
- User-facing latency budgets. Allocate your total latency budget (say, 2 seconds for a chat response) across components: 200 ms for your backend processing, 300 ms for network transit, 1500 ms for inference. When probe data shows inference eating into the network budget, you know the provider is the bottleneck.
Enterprise latency monitoring checklist
Use this checklist during your next quarterly review:
Your progress is saved automatically in your browser.
Frequently Asked Questions
Start monitoring before the next incident
Enterprise teams that wait for user complaints to discover latency problems are always one step behind. Setting up multi-region synthetic probes, defining SLOs per feature, and automating degradation alerts transforms your team from reactive to predictive. Observinio provides daily latency probes from 21 global regions, baseline comparisons, and email alerts when OpenAI or OpenRouter response times degrade, so your on-call engineer knows about a slowdown before your users do. Check the live status page or get in touch to see how your regions are performing right now.
Additional Resources
- Implement Advanced Monitoring for Foundry Models ... - Monitoring workloads that include Azure OpenAI in Foundry Models can be as simple as enabling diagnostics for Azure OpenAI and using preconfigured ...
- Severe latency on Azure OpenAI GPT-4o in North Central US - We're seeing severe latency on Azure OpenAI Service GPT-4o deployments in the North Central US region starting around 7:00 AM EST today. Symptoms ...
- Production best practices | OpenAI API - API key usage can be monitored on the Usage page once tracking is enabled. You can enable tracking going forward on the API key management dashboard.