
Photo by Дмитрий Рощупкин from Pexels
Most production systems that depend on LLM APIs treat them as black boxes. You send a request to OpenAI or OpenRouter, you get a response, and you log some metrics to your APM dashboard. But that single log entry hides critical blind spots: Was the latency spike regional? Did the degradation originate with the provider or your own routing layer? Which endpoint actually delivered the best TTFB (time-to-first-byte) for your European users last Tuesday? Without synthetic probes across multiple global regions and provider baselines, you cannot answer these questions until a customer complains.
TL;DR
- Regional variance is hidden by aggregate metrics. Provider latency fluctuates across 21+ regions; observing only global averages masks regional slowdowns that affect specific user cohorts.
- Provider visibility is asymmetric. OpenAI and OpenRouter publish uptime, not latency SLOs; you have no baseline to detect real degradation from normal variance.
- Incident discovery lags. Most teams learn about LLM API slowdowns through support tickets, not proactive monitoring, adding 30–60 min to MTTR.
- Provider switching decisions lack evidence. Choosing between OpenRouter and direct provider APIs requires real latency data by region, not marketing claims.
- Synthetic probes close the gap. Daily or hourly probes from 21 regions, with degradation alerts and weekly summaries, shift you from reactive to predictive observability.
Why LLM APIs Are Harder to Observe Than You Think
Traditional infrastructure observability, APM, logs, traces, was built for systems you control. You instrument your application code, you own the servers, you see every layer. LLM APIs are fundamentally different: they are third-party black boxes. Your only signals are request/response pairs across the network, and those signals are noisy.
Consider a typical integration. Your application sends a completion request to OpenAI's API and logs the end-to-end latency. If that request takes 2 seconds, you cannot tell whether:
- The API server was slow (provider issue).
- Network routing from your region was congested (ISP or peering issue).
- Your client retry logic retried due to a transient timeout (your bug).
- The model inference engine had a queue (load spike at provider).
"The era of single-turn LLM calls is behind us.">, LLM Observability for AI Agents & Applications
Agentic systems amplify this problem. If an AI agent makes 10 sequential API calls (each with a 300 ms baseline latency), the total runtime explodes to 3+ seconds. A single unobserved regional slowdown in step 3 cascades through the entire workflow.
The Three Blind Spots
1. Regional Latency Variance Is Invisible
Most observability stacks measure latency from your origin, usually a single region or a small cluster. If your inference servers run in us-east-1, you see latency as measured from there. But your end users span Europe, Asia, and North America. A provider's API might have 150 ms latency from us-east-1 and 900 ms from ap-southeast-1, yet your dashboard shows only the average.

Without probes in 21+ regions, you miss:
- Regional provider degradation (e.g., OpenAI's Tokyo endpoint slow, US unaffected).
- Routing asymmetry (your request to Tokyo is fast, but the response path is congested).
- Provider-specific regional issues (OpenRouter in eu-west-1 slower than OpenAI on the same day).
2. Provider Baselines Are Missing
OpenAI and OpenRouter publish uptime SLOs (e.g., "99.9% availability") but not latency baselines. You have no ground truth. If your TTFB jumps from 400 ms to 800 ms, is that a real provider degradation or normal variance? Without a baseline from the same provider measured in the same region over time, you cannot tell.
This matters for two reasons:
- Alert precision: You might trigger an alert on normal variance and ignore real degradation.
- Provider decisions: Should you switch from OpenRouter to direct OpenAI? You need latency data from both, measured in your user regions, not marketing material.
3. Incidents Are Discovered Reactively
Most observability for third-party APIs is application-centric: you measure latency from your servers to the API and back. If the API slows down, your application sees higher latency, and you might emit a metric. But by then, the problem is already affecting users. The typical flow:
- Provider latency increases (unobserved).
- Your application latency increases (observed but flagged as anomaly, not root-caused).
- Chat feature feels slow (users notice).
- Support tickets arrive (escalation).
- You trace the issue to the LLM API (30–60 min later).
- Provider publishes incident post-mortem (hours later).
Building Observability That Works: A Practical Approach

Closing these gaps requires three layers:
Layer 1: Synthetic Probes Across Multiple Regions
Deploy lightweight probes that send test requests to your LLM providers from 21+ global regions on a regular schedule (daily or hourly). Each probe logs:
- TTFB (time-to-first-byte): Latency until the first token arrives. Measures network + initial inference latency.
- TTFT (time-to-first-token): Similar to TTFB; sometimes used interchangeably.
- Time-to-complete: End-to-end latency for a full response.
- Region and provider: Tag every measurement with origin region and target endpoint.
POST /v1/chat/completions
Host: api.openai.com
Region: eu-west-1
Timestamp: 2025-09-03T14:00:00Z
Payload: { "model": "gpt-4o-mini", "messages": [...] }
Response: TTFB=187ms, TTFT=195ms, Complete=450ms
Run this probe daily (or hourly for high-sensitivity systems) and store results in a time-series database. Over time, you build a latency baseline per provider/region pair.
Layer 2: Baseline Comparison and Anomaly Detection
Once you have baseline data, use statistical methods to detect real degradation:
- Z-score method: If today's latency is >2 standard deviations above the 30-day rolling average, flag as anomaly.
- Threshold method: If TTFB exceeds SLO (e.g., 500 ms), alert immediately.
- Regional comparison: If Europe is 2x slower than US on the same provider/model, escalate.
if (latency_eu_west_1 > baseline_eu_west_1  1.5
    AND latency_us_east_1 < baseline_us_east_1  1.2)
{
  alert("Regional degradation: OpenAI eu-west-1 +50%");
}
Layer 3: Weekly Trend Reports and Comparative Analysis
Every week, generate a report showing:
- Provider latency trend: Is OpenAI or OpenRouter getting faster or slower?
- Regional breakdown: Which regions had highest/lowest latency?
- Provider comparison: Head-to-head latency for the same model in each region.
- Incidents and root causes: Links to known provider incidents.
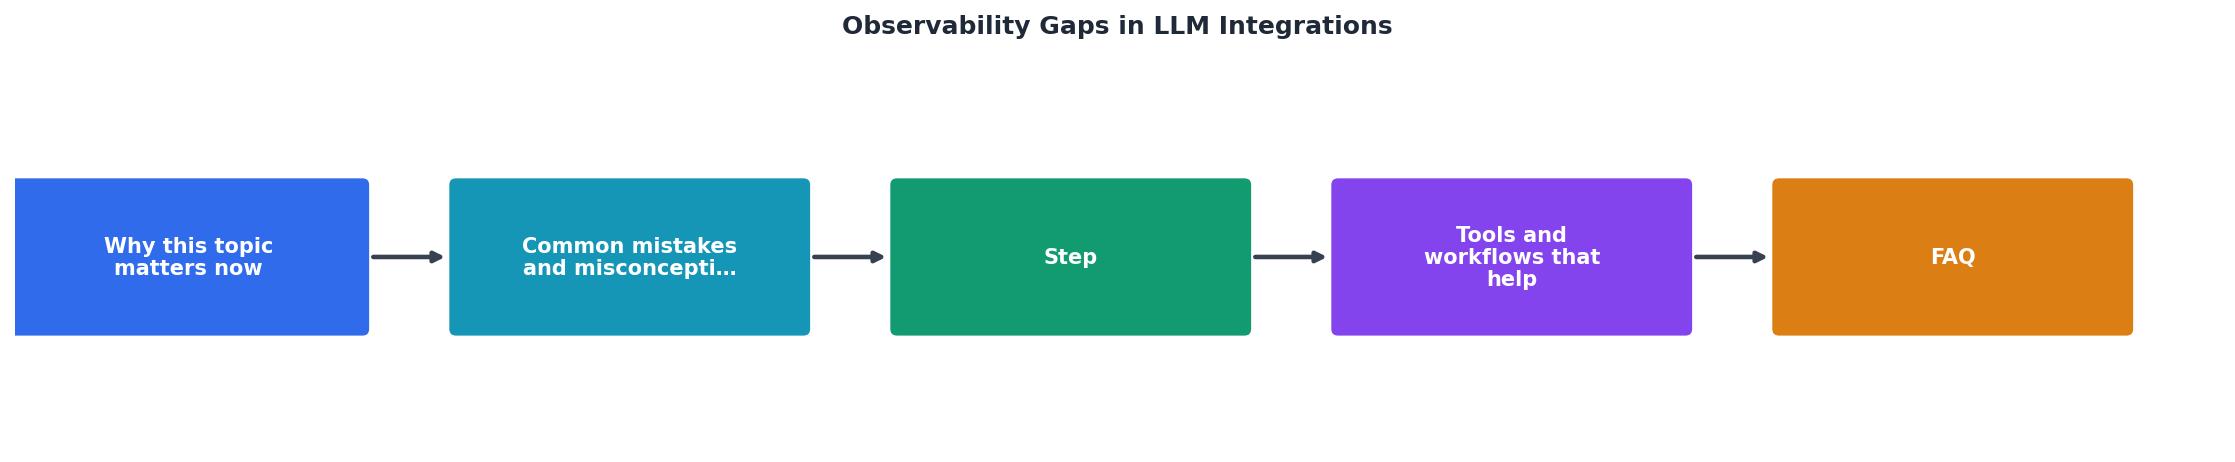
Observability Gaps in LLM Integrations at a Glance
Your progress is saved automatically in your browser.
Common Pitfalls and How to Avoid Them
Pitfall 1: Relying Only on Production Traffic
If you measure latency only from your production servers, you see only your traffic pattern. If your app is heavily used in one region, you get blind spots in others. Fix: Synthetic probes run independently, filling the blind spots.
Pitfall 2: Not Accounting for Provider Updates
Provider behavior changes with model updates, infrastructure changes, and load patterns. A baseline from 6 months ago is stale. Fix: Roll forward your baseline every 30 days; flag if current latency exceeds rolling average by >20%.
Pitfall 3: Conflating Latency with Availability
A provider can be "up" (responds) but slow (high TTFB). Your uptime monitoring misses this. Fix: Track latency and availability separately; alert on latency degradation even if availability is at 100%.
Pitfall 4: Ignoring Cost-Latency Tradeoffs
Cheaper models (e.g., gpt-4o-mini) sometimes have higher latency. Routing decisions must weigh cost, latency, and quality together. Fix: Include model and pricing tier in your baseline comparisons.
Implementation Timeline
Typical Observability Implementation Timeline
- Week 1: Deploy synthetic probes to 3 primary regions (us-east-1, eu-west-1, ap-southeast-1)
- Week 2–3: Establish baseline latency for primary providers over 14 days of data collection
- Week 4: Set up baseline-relative alerting (>1.5× rolling average triggers alert)
- Week 5–6: Expand probes to full 21-region coverage and enable regional degradation detection
- Week 7–8: Generate first comparative analysis report (OpenAI vs OpenRouter by region) and publish weekly summaries
Starting from day one, you'll detect real provider incidents within hours instead of days, shifting your team from reactive troubleshooting to predictive performance management.
FAQ
Frequently Asked Questions
Next Steps
Start small: pick one LLM provider (OpenAI or OpenRouter) and one critical region (us-east-1 or eu-west-1). Deploy a daily synthetic probe that sends a test completion request and logs TTFB. Store the result in a time-series database (Prometheus, InfluxDB, or similar). After two weeks of baseline data, set an alert: if TTFB exceeds 1.5× the rolling 14-day average, page on-call.
Once you have confidence in the probe, expand to 5 regions, then 21. Add provider comparisons. Publish weekly reports to your platform team. Build a habit of checking latency trends before provider decisions, not after incidents.
If you want to accelerate, use Observinio's daily probes and 21-region coverage out of the box. Set up degradation alerts in minutes and start receiving weekly latency summaries tomorrow. Visit /providers/openrouter to see real latency data across regions, or check your provider's status and latency trends directly on the Observinio status page.
Additional Resources
- LLM Observability for AI Agents & Applications - LLM observability addresses this gap. It provides structured visibility into how LLMs and agents behave, from individual spans within a trace to full multi ...
- LLM and agentic AI observability - Elastic provides a powerful LLM observability framework including key metrics, logs, and traces, along with pre-configured, out-of-the for LLM APIs (via ...
- LLM Observability: Tutorial & Best Practices - LLM observability fills this gap by enabling teams to do all of the following: Track both technical and semantic performance, including ...