
Photo by Tima Miroshnichenko from Pexels
GPT-4o is fast, until it isn't. A chat completion that returns its first token in 280 ms from Virginia can easily take 900 ms or more when the request originates from São Paulo or Mumbai. If your product serves users globally, a single aggregate latency number hides the reality your customers experience. This article walks through why regional GPT-4o latency matters, what metrics to track, and how to set up continuous monitoring across 21 probe locations so you catch degradation before your users do.
TL;DR
- GPT-4o latency varies dramatically by region; TTFB differences of 2–3× between US-East and Asia-Pacific are common.
- Aggregate averages mask regional pain, you need per-region baselines and per-region alerts.
- Time to First Byte (TTFB) and Time to First Token (TTFT) are the two metrics that matter most for perceived chat speed.
- Daily synthetic probes from multiple regions give you a ground-truth dataset independent of your own infrastructure.
- Observinio runs exactly this kind of probe grid, 21 regions, daily checks, automatic baseline comparison, and email alerts on degradation.
Why a Single Latency Number Lies
Most teams start monitoring LLM API latency the same way they monitor any HTTP dependency: they add a timer around the call in their application code and ship the p50/p95 to their APM dashboard. That works fine when your traffic comes from one region and hits one endpoint. GPT-4o deployments, however, are not uniformly distributed. OpenAI and OpenRouter route requests through different data centers depending on load, capacity, and sometimes seemingly at random.
The result is that your application-side p95 is a weighted blend of every region your users happen to be in. If 80 % of your traffic is US-based, a severe slowdown in Europe or Southeast Asia barely moves the aggregate needle, but it absolutely destroys the experience for the 20 % of users in those regions. You need region-specific visibility.
The metrics that matter
Not all latency metrics are created equal for LLM APIs. Here are the ones worth tracking for GPT-4o specifically:
- Time to First Byte (TTFB): The interval from sending the HTTP request to receiving the first byte of the response. This captures network round-trip plus server queue time. For streaming completions, a high TTFB means the user stares at a blank chat bubble.
- Time to First Token (TTFT): Closely related to TTFB but measured at the application layer, the time until the first actual token appears in the streamed response. TTFT includes any protocol overhead on top of TTFB.
- Total completion time: End-to-end wall-clock time for the full response. Useful for batch or non-streaming use cases, but less important for perceived speed in chat UIs.
- Inter-token latency (ITL): The average gap between successive tokens during streaming. A sudden increase in ITL mid-stream can indicate provider-side throttling or capacity pressure.
Where Regional Variance Comes From

Regional latency variance for GPT-4o has multiple root causes, and understanding them helps you decide what to monitor and where.
Network distance and routing
The most obvious factor is physics. A request from Tokyo to a US-East inference cluster adds roughly 150–180 ms of round-trip network latency before any model computation begins. If the provider does not have inference capacity in Asia-Pacific, every request from that region pays this tax. OpenRouter adds another hop, your request goes to OpenRouter's edge, then to the upstream provider, which can add or sometimes reduce latency depending on OpenRouter's peering arrangements.
Provider-side load balancing
OpenAI distributes GPT-4o inference across multiple clusters. During peak US business hours, clusters serving North America may experience higher queue depths, pushing TTFT up. Meanwhile, European clusters might be relatively idle. The reverse happens during European business hours. This creates time-of-day patterns that differ by region.
Throttling and rate limits
Rate limits are applied per-organization, but the enforcement infrastructure itself can introduce latency. When you are close to your token-per-minute ceiling, requests may be held in a queue rather than rejected outright, adding hundreds of milliseconds of invisible delay. This effect can vary by the endpoint region handling your request.
Model updates and capacity shifts
OpenAI periodically updates GPT-4o's serving infrastructure. These rollouts are not always simultaneous across all regions. A capacity reduction in one data center during a migration can cause a temporary latency spike that only affects requests routed to that specific cluster. Without multi-region monitoring, you might never notice, or worse, you notice only when a customer in that region files a support ticket.
"The monitoring of potential terrorists is done by the CIA, and the monitoring of local criminals is performed by local police.">, Monitoring
The analogy holds for API monitoring: global oversight catches systemic issues, but you also need local probes to catch region-specific problems that global aggregates miss entirely.
Building a 21-Region Monitoring Grid

A robust monitoring setup for GPT-4o latency requires probes distributed across every region where you have users, or plan to have users. Here is the approach Observinio uses, which you can replicate conceptually or adopt directly.
Regions to cover
A good starting set of 21 regions spans the major cloud availability zones where production workloads typically run:
- North America: US-East (Virginia), US-West (Oregon), US-Central (Iowa), Canada (Montreal)
- Europe: West Europe (Netherlands), North Europe (Ireland), France (Paris), Germany (Frankfurt), UK (London), Sweden (Stockholm)
- Asia-Pacific: Japan (Tokyo), South Korea (Seoul), Singapore, Australia (Sydney), India (Mumbai), Hong Kong
- South America: Brazil (São Paulo)
- Middle East & Africa: UAE (Dubai), South Africa (Johannesburg), Bahrain
- Other: US-South (Texas)
Step-by-step: setting up continuous latency probes
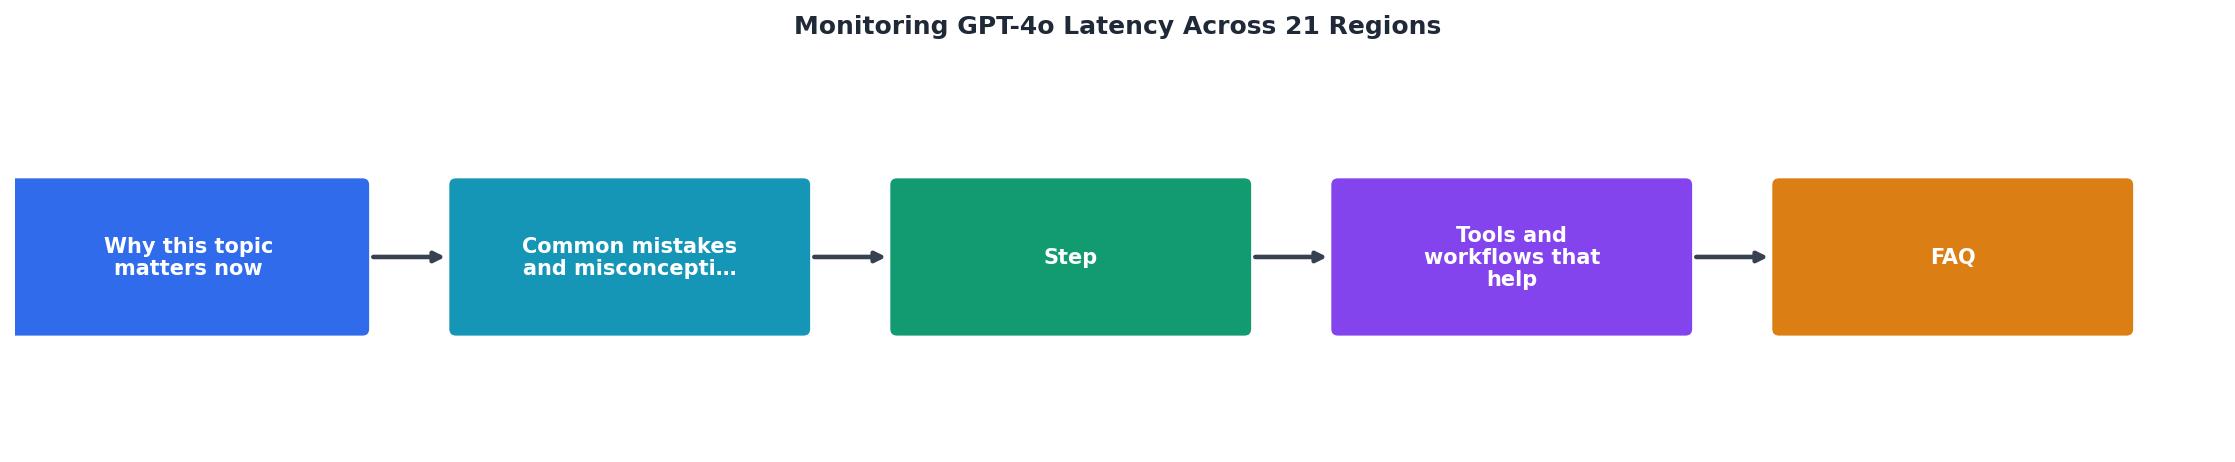
Follow these steps to establish a reliable multi-region monitoring pipeline for GPT-4o:
- Define a canonical probe request. Choose a fixed system prompt and user message that produces a short, deterministic-length response. Keep
max_tokenslow (e.g., 50) so you are measuring infrastructure latency, not generation time. Usetemperature: 0for consistency. - Deploy probe runners in each region. Use serverless functions (AWS Lambda, Google Cloud Functions, Azure Functions) in each of the 21 regions. Each function executes the canonical request and records timestamps at key points: request sent, first byte received, first token parsed, last token received.
- Schedule probes at consistent intervals. Daily probes are the minimum for trend detection. Hourly probes give you faster incident detection. Avoid running all 21 probes at the exact same second, stagger them by a few seconds to reduce the chance of correlated rate-limit hits.
- Store results with region and timestamp metadata. Every probe result should include: region ID, probe start time (UTC), TTFB in milliseconds, TTFT in milliseconds, total time in milliseconds, HTTP status code, and any error message.
- Compute per-region baselines. After two weeks of data, calculate the rolling p50 and p95 for each metric in each region. These baselines become your comparison point for anomaly detection.
- Set alert thresholds relative to baselines. A good starting rule: alert when the current probe's TTFT exceeds the region's p95 baseline by more than 30 %. This catches real degradation while avoiding noise from normal variance.
- Review weekly summaries. Aggregate the week's data into a per-region report showing trend direction (improving, stable, degrading) and any alert events. This is where you spot slow-burn regressions that never trigger a single-probe alert but show a clear upward trend over days.
Probe request example
Here is a minimal Python snippet for a single probe measurement against the OpenAI API:
import time
import openai

client = openai.OpenAI()

start = time.perf_counter()
response = client.chat.completions.create(
    model="gpt-4o",
    messages=[
        {"role": "system", "content": "Reply in exactly five words."},
        {"role": "user", "content": "What is API latency monitoring?"},
    ],
    max_tokens=50,
    temperature=0,
    stream=True,
)

ttfb = None
ttft = None
for chunk in response:
    if ttfb is None:
        ttfb = time.perf_counter() - start
    if chunk.choices and chunk.choices[0].delta.content:
        if ttft is None:
            ttft = time.perf_counter() - start

total = time.perf_counter() - start

print(f"TTFB: {ttfb1000:.0f} ms")
print(f"TTFT: {ttft1000:.0f} ms")
print(f"Total: {total*1000:.0f} ms")
Deploy this (or its equivalent) in each region, swap in the OpenRouter base URL to compare routing overhead, and you have the raw data you need.
What to Do When You Detect Regional Degradation
Detecting a latency spike is only useful if you have a response plan. Here is a practical checklist for when an alert fires:
Your progress is saved automatically in your browser.
Comparing OpenRouter vs. Direct OpenAI Endpoints
One of the most common questions from teams using GPT-4o is whether OpenRouter adds meaningful latency compared to calling OpenAI directly. The answer depends on the region. OpenRouter maintains edge infrastructure that can actually reduce latency for some regions by providing a closer TLS termination point. For other regions, the extra hop adds 20–80 ms.
The only way to know for your specific traffic pattern is to measure both. Run parallel probes, one hitting api.openai.com directly, one hitting openrouter.ai/api, from each of your 21 regions. After a week of data, you will have a clear per-region comparison. Observinio does exactly this, probing both OpenRouter and OpenAI direct endpoints so you can see the difference on the status page without building the infrastructure yourself.
| Region | OpenAI Direct TTFT (ms) | OpenRouter TTFT (ms) | Difference |
|---|---|---|---|
| US-East (Virginia) | 280 | 295 | +15 ms |
| West Europe (Netherlands) | 420 | 390 | −30 ms |
| Japan (Tokyo) | 680 | 710 | +30 ms |
| Brazil (São Paulo) | 900 | 860 | −40 ms |
| India (Mumbai) | 850 | 820 | −30 ms |
FAQ
Frequently Asked Questions
Start Monitoring Before the Next Incident
Regional latency problems are invisible until they hit your users, and by then, you are already in incident response mode. Observinio gives you daily GPT-4o latency probes from 21 regions, automatic baseline comparison, and email alerts when any region degrades beyond its normal range. You also get weekly summary reports that surface slow-burn trends. Check the status page to see current regional latency data, or visit the contact page to set up alerts for your team.
Additional Resources
- Monitoring - Monitoring (medicine), the observation of a disease, condition or one or several medical parameters over time
- Monitoring - Definition, Meaning & Synonyms - To monitor is to keep an eye on someone or something, often through recording devices. Monitoring, then, is the act of keeping tabs on others. A lot of ...
- monitoring - Glossary | CSRC - Continual checking, supervising, critically observing or determining the status in order to identify change from the performance level required or expected.