
Cold-start latency in LLM serving is the hidden tax on every production inference pipeline. When a model container spins up, GPU memory initializes, or a new inference worker boots for the first time, users experience delays that compound across global deployments. This article walks you through measuring, isolating, and reducing cold-start overhead in your LLM infrastructure, and how to integrate regional cold-start data into your production monitoring strategy.
TL;DR
- Cold-start latency includes container initialization, model loading, GPU memory allocation, and first-token generation; it can add 500 ms to 5 seconds per request in production.
- Regional variance is critical: cold starts in Tokyo may take 2× longer than Frankfurt due to network distance, provider capacity, and hardware mix.
- Measure cold-start separately from warm-cache latency using synthetic probes from multiple regions; track Time-to-First-Byte (TTFB) as your primary metric.
- Most serverless GPU inference is not truly serverless; cold starts happen frequently when traffic patterns change or capacity is reallocated.
- Set baselines per region and provider, then alert when cold-start latency drifts beyond acceptable thresholds.
Key Takeaway
Cold-start latency in production LLM serving typically adds 500 ms to 5 seconds per request and varies significantly by region. By measuring TTFB (Time-to-First-Byte) through synthetic probes from multiple regions and comparing against warm-cache baselines, you can isolate cold-start overhead, detect provider degradation, and make data-driven decisions about capacity planning and provider selection.
Understanding Cold-Start Latency
Cold-start latency occurs when an LLM inference endpoint must allocate fresh resources before serving your request. This is distinct from warm-cache latency, where model weights are already loaded and GPU memory is pre-allocated.
"Most "serverless" GPU inference isn't actually serverless.">, LLM Cold Starts: Industry State and Challenges
The components of a cold-start cycle are:
- Container or process initialization (10–200 ms): Spinning up a new kernel, allocating system memory, loading Python runtime.
- Model weight loading (100–2000 ms): Fetching model files from disk or object storage and placing them into GPU VRAM. Larger models (70B+ parameters) incur longer penalties.
- GPU memory setup (50–500 ms): Allocating tensor buffers, compiling kernels for your specific GPU, and initializing CUDA contexts.
- First inference pass (100–1000 ms): The initial forward pass, which may include recompilation or cache misses that warm requests avoid.
- Network overhead (20–200 ms): Request routing, TLS handshake, and provider ingestion delays.
Why Regional Variance Matters
Cold-start latency varies significantly across geographic regions. Your São Paulo users may experience 1.8× longer cold starts than Frankfurt users because:
- Network distance and routing: Requests from São Paulo traverse more hops and face variable packet loss before reaching the provider's data center.
- Regional capacity: Popular regions (US East, EU West) have deeper hardware pools and pre-warmed GPU clusters; less trafficked regions scale up on-demand.
- Provider infrastructure: OpenAI, OpenRouter, and other providers run independent capacity in each region. A spike in Tokyo traffic does not immediately add capacity in Singapore.
- Model distribution: Large models are not replicated equally across regions. Rare regions may load models from remote caches, adding latency.
- Provider degradation specific to Singapore.
- Cold starts triggered by a traffic pattern shift in that region.
- Network routing issues between your users and the provider.
Measuring Cold Starts: The Method
Cold-start measurement requires synthetic probes because production traffic is too noisy to isolate cold starts reliably. Here is a step-by-step method:
1. Create a Cold-Start Test Scenario
Design a probe that mimics a real user request but runs on a schedule that guarantees cold starts:
- Vary the model: Rotate between different models (gpt-4-turbo, gpt-3.5-turbo, claude-opus) to trigger cold starts across your inference fleet.
- Use distinct headers or metadata: Tag probes with a unique ID so you can filter them from production metrics.
- Keep payload consistent: Send the same prompt each time to isolate cold-start overhead from inference complexity.
{
  "model": "gpt-4-turbo",
  "messages": [
    {
      "role": "user",
      "content": "What is 2 + 2?"
    }
  ],
  "temperature": 1,
  "max_tokens": 10,
  "observinio-probe": "cold-start-measurement"
}
2. Run Probes from Multiple Regions
Deploy probe endpoints in your 21 key regions (or the subset covering your users). Each region should:
- Send requests every 15–60 minutes to ensure fresh container initialization.
- Record the full request duration (Time-to-First-Byte, TTFB) and Time-to-Last-Byte (TTLB).
- Capture HTTP status, error codes, and any provider-specific metadata (e.g., OpenAI's
x-response-timeheader).
3. Isolate TTFB as Your Cold-Start Signal
Time-to-First-Byte (TTFB) is the elapsed time from request send to receiving the first response byte. For LLM APIs, this includes:
- Network latency to the provider.
- Provider request ingestion and parsing.
- Model loading and GPU memory setup (the cold-start penalty).
- First token generation time.
4. Compare Against Warm Baselines
Run a second probe suite that explicitly requests the same model repeatedly (no rotation) from each region. Record TTFB for these warm requests. The delta between cold and warm TTFB is your cold-start penalty:
Cold-start penalty (region) = TTFB(cold) - TTFB(warm)
A healthy cold-start penalty is 200–800 ms per region. Penalties exceeding 2 seconds suggest provider scaling issues or network problems.
5. Set Regional Baselines
Calculate a 7-day rolling percentile (p95 or p99) for cold-start TTFB in each region. This becomes your regional baseline:
| Region | Warm TTFB (p95) | Cold TTFB (p95) | Penalty | Baseline |
|---|---|---|---|---|
| us-east-1 | 120 ms | 580 ms | 460 ms | 580 ms |
| eu-west-1 | 130 ms | 620 ms | 490 ms | 620 ms |
| ap-southeast-1 | 200 ms | 980 ms | 780 ms | 980 ms |
| sa-east-1 | 250 ms | 1480 ms | 1230 ms | 1480 ms |
Practical Implementation

Cold-Start Measurement Checklist
Your progress is saved automatically in your browser.
Integration with Observinio
Observinio's daily probe engine and multi-region architecture are purpose-built for cold-start measurement. Here is how to use it:
- Create custom probe rules for each model and region pair.
- Set baseline alerts that fire when TTFB drifts beyond your regional thresholds.
- View regional cold-start breakdown in the Observinio dashboard; compare OpenRouter vs. direct OpenAI endpoints side by side.
- Receive weekly summaries highlighting which regions showed the worst cold-start regression and which models triggered the most cold starts.
- Export probe logs to correlate cold-start spikes with your own infrastructure changes or provider incidents.
Common Pitfalls and Solutions
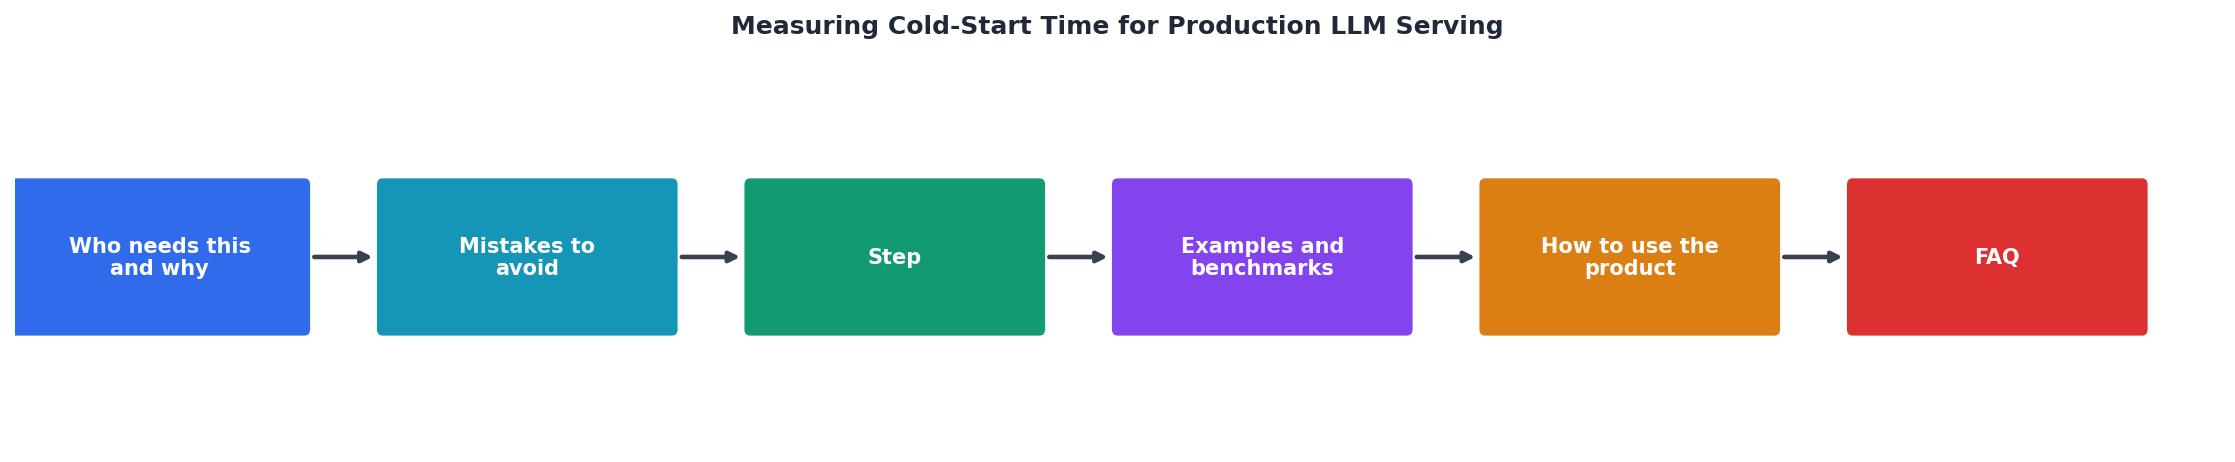
⚠️ Five Critical Mistakes in Cold-Start Measurement
Avoid these common errors that lead to inaccurate metrics and failed optimization efforts. Each pitfall has a corresponding solution to ensure reliable cold-start monitoring across your LLM infrastructure.
Pitfall 1: Confusing TTFB with inference time
TTFB includes token generation; for a 1-token response from gpt-3.5-turbo, TTFB might be 150 ms. For a 100-token response, TTFB could be 300 ms even in a warm cache. Always subtract warm-cache TTFB to isolate cold-start overhead.
Pitfall 2: Insufficient regional coverage
If you only probe from 3 regions and your users span 15, you will miss cold-start degradation in undermonitored areas. Aim for at least one probe per 200 million users or major geographic zone.
Pitfall 3: Not accounting for model size
A 7B-parameter model cold-starts in ~300 ms; a 70B model takes ~2 seconds. Track cold-start penalties per model, not as a single average.
Pitfall 4: Ignoring seasonal patterns
Cold starts spike during business hours (higher traffic → more scaling events) and drop at night. Use rolling baselines, not static thresholds, to avoid false alarms.
Pitfall 5: Missing provider switching
If you rotate between OpenRouter and direct OpenAI APIs, cold-start profiles differ. Label each probe with the provider to track their independent cold-start behavior.
FAQ
Frequently Asked Questions
Next Steps
Cold-start measurement is the foundation of predictable LLM latency in production. By instrumenting your LLM serving infrastructure with regional probes, you gain visibility into the initialization tax that impacts every user's first interaction with your AI features.
Start with a small set of probes, two regions, one model, 30-minute interval, and measure cold-start TTFB for one week. Calculate regional baselines and set alerts for 20% drift. Then expand to cover your full user geography and model portfolio.
Observinio makes this workflow seamless: create probes once, monitor cold-start latency across 21 regions daily, and receive weekly summaries highlighting which regions and models need attention. When cold starts spike, you will know within hours, and have the regional data to decide whether to add capacity, switch providers, or optimize your routing.
Measure cold starts today. Your users' first token experience tomorrow will be faster for it. With systematic regional monitoring, historical baselines, and regional degradation alerts integrated into your observability platform, you transform cold-start management from guesswork into engineering discipline.
Additional Resources
- LLM Cold Starts: Industry State and Challenges - Some providers measure “model loaded” and call it a cold start. That's not a cold start. That's half the problem. The only concrete true cold ...
- Cold Start Latency on Serverless Inference: What... - A fully cold self-hosted 8B model takes ~157 seconds, dropping to a 53-second floor once warm. The pooled serverless platform hides nearly all ...
- Cut LLM container cold starts to under 30 seconds on ... - We just published the full breakdown of how we cut #LLM container cold starts to under 30 seconds on #Kubernetes https://lnkd.in/giyjQNwV ...