
Photo by Adriano Ponte Abreu from Pexels
Shipping an LLM-powered feature without a latency SLO is like deploying a database without monitoring query time, you will only learn about problems from angry users. Service Level Objectives give your team a concrete, measurable contract for how fast your AI-backed endpoints should respond. They turn vague complaints like "the chatbot feels slow" into actionable engineering targets that you can track, alert on, and improve over time.
TL;DR
- A latency SLO defines the maximum acceptable response time (e.g., p95 TTFB < 800 ms) for your LLM-powered feature, measured from the user's perspective.
- LLM API latency is highly variable across providers, models, regions, and time of day, generic uptime SLAs from providers are not enough.
- You need separate SLO targets for Time to First Byte (TTFB), Time to First Token (TTFT), and total completion time because each maps to a different user experience.
- Regional variance can easily double your latency; a model that responds in 400 ms from Virginia may take 900 ms from Singapore.
- Continuous synthetic probing from multiple regions is the only reliable way to track whether you are meeting your SLOs before users notice degradation.
Why Traditional SLAs Fall Short for LLM APIs
Most LLM API providers publish an uptime SLA, typically 99.9% availability, but say almost nothing about latency guarantees. An API can be "up" while responding three times slower than usual, and that uptime SLA will not trigger any remediation. For a chat interface where users expect sub-second first-token delivery, a 2× latency regression is functionally equivalent to an outage.
Traditional REST APIs serving static data or simple CRUD operations have relatively predictable response times. LLM inference is fundamentally different. Response time depends on the model size, prompt length, output token count, current GPU utilization on the provider side, and the routing layer if you use an aggregator like OpenRouter. This means your p50 and p99 latencies can diverge wildly, a 300 ms median with a 3-second p99 is not unusual during peak hours.
"Most teams are using hosted LLM APIs or third-party model providers.">, What Is LLM Observability and Monitoring?
Because you do not control the inference infrastructure, you cannot simply "optimize the query." Instead, you need an SLO framework that acknowledges this external dependency and gives you early warning when the provider's performance drifts outside your acceptable range.
The Three Latency Metrics That Matter

Not all latency is created equal. When defining SLOs for LLM-powered products, you should track three distinct metrics, each mapping to a different moment in the user experience:
1. Time to First Byte (TTFB)
TTFB measures the elapsed time from when your backend sends the API request to when the first byte of the HTTP response arrives. This captures network latency, TLS negotiation, load-balancer queuing, and initial request processing on the provider side. A high TTFB means your users are staring at a blank screen or a spinner before anything happens at all.
Typical SLO target: p95 TTFB < 500–800 ms, depending on region and model.
2. Time to First Token (TTFT)
For streaming completions, TTFT is the time until the first actual content token arrives in the SSE stream. This is what determines the perceived responsiveness of a chat interface. Users can tolerate a longer total generation time if they see tokens appearing quickly. TTFT is usually slightly higher than TTFB because the provider needs to run at least one forward pass before emitting the first token.
Typical SLO target: p95 TTFT < 1–2 seconds for interactive chat; up to 3–5 seconds for batch or background tasks.
3. Total Completion Time (TCT)
TCT is the wall-clock time from request to the final token. This matters most for non-streaming use cases, function calling, structured output extraction, or any workflow where you need the full response before proceeding. TCT is heavily influenced by output token count, so your SLO should account for expected response length.
Typical SLO target: p95 TCT < 5–10 seconds for short completions (< 500 tokens); scale proportionally for longer outputs.
Each of these metrics should have its own SLO target. Collapsing them into a single "latency" number hides critical information about where the bottleneck lives.
| Metric | What It Measures | Best For | Typical p95 Target |
|---|---|---|---|
| TTFB | First byte of HTTP response | Network and queuing diagnostics | 500–800 ms |
| TTFT | First content token in SSE stream | Perceived chat responsiveness | 1–2 seconds |
| TCT | Full completion wall-clock time | Non-streaming and function-calling flows | 5–10 seconds |
How Regional Variance Breaks Your Assumptions
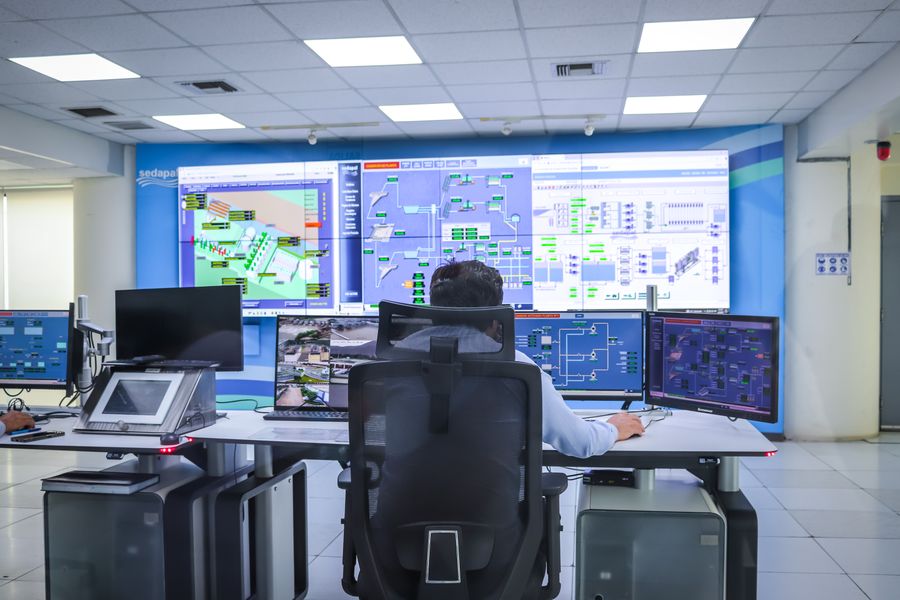
If your users are global but you only measure latency from us-east-1, your SLO is a fiction for everyone outside North America. LLM API providers typically concentrate GPU capacity in a handful of data centers. When a request originates from São Paulo, Sydney, or Mumbai, the round-trip network penalty alone can add 150–400 ms before inference even begins.
Here is what regional variance looks like in practice:
- US East → OpenAI: TTFB around 200–400 ms during off-peak, 400–700 ms during peak.
- EU West → OpenAI: Add 80–120 ms of network latency on top of the US baseline.
- Southeast Asia → OpenRouter: Routing through US-based upstream providers can push TTFB past 600–900 ms consistently.
- South America → any US-hosted provider: Expect 150–250 ms of pure network overhead before any processing begins.
This means a single global SLO like "p95 TTFB < 500 ms" may be achievable from Virginia but physically impossible from Jakarta. You have two options: set region-specific SLO targets, or architect your system with regional routing to bring all users within a single global target.
Observinio's daily probes from 21 global regions give you exactly this data, real TTFB and TTFT measurements from the locations where your users actually are, not just from your own data center.
Step-by-Step: Defining Your First Latency SLO
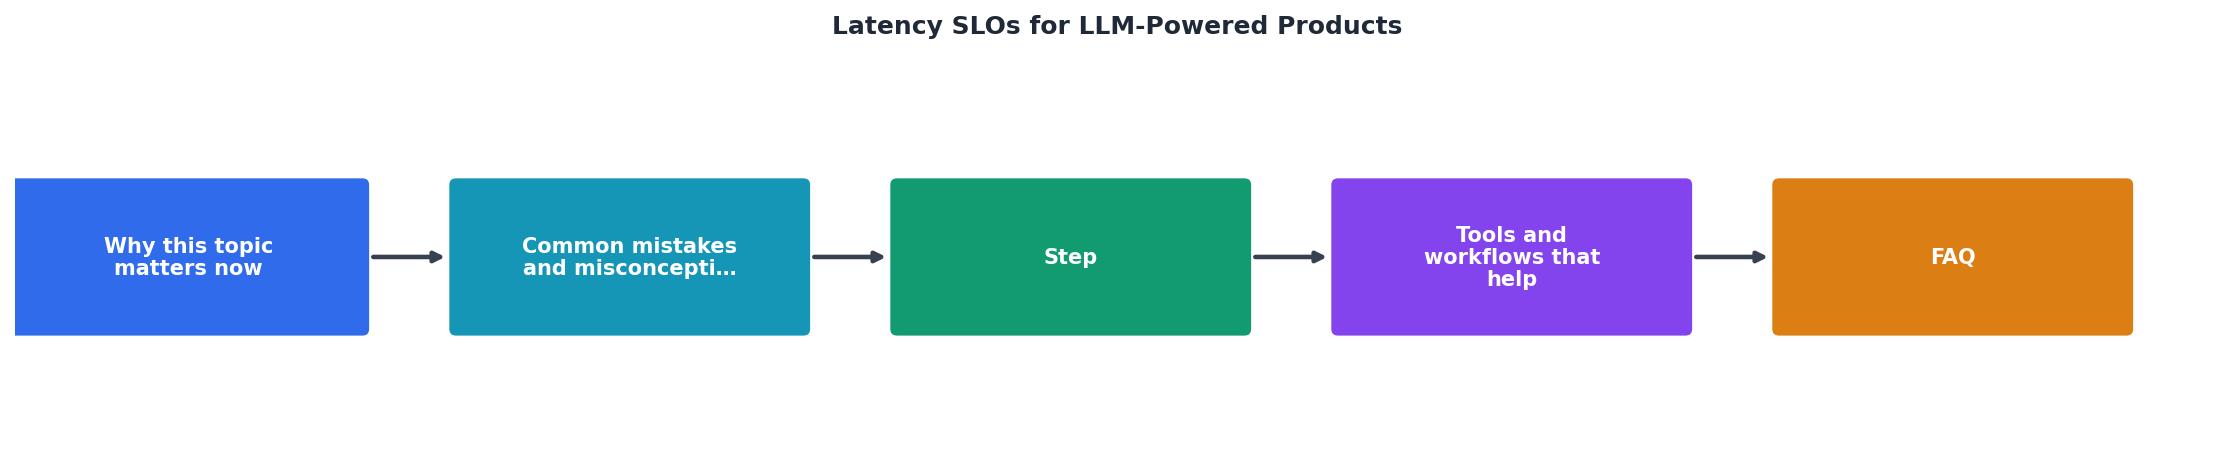
Follow these steps to go from "we have no latency targets" to a working SLO framework in a single sprint:
- Inventory your LLM-dependent features. List every user-facing feature that calls an LLM API. For each, note whether it uses streaming or non-streaming, the typical prompt size, and the expected output length. A chat assistant and a background summarization job need very different SLO targets.
- Collect a baseline. Before setting targets, measure what you actually get today. Instrument your LLM API calls to log TTFB, TTFT, and TCT with region tags. Run this for at least one full week to capture weekday/weekend and peak/off-peak variance. If you do not have instrumentation yet, Observinio's status page provides baseline data for OpenRouter and OpenAI endpoints across all 21 regions.
- Set percentile targets. Use your baseline data to set realistic targets. A common starting point: take your current p50 and set your SLO at roughly 1.5–2× that value at the p95 level. For example, if your p50 TTFT is 600 ms, a p95 SLO of 1,200 ms gives you headroom for normal variance while still catching real regressions.
- Define the error budget. An SLO of "p95 TTFT < 1,200 ms" means you tolerate 5% of requests exceeding that threshold. Over a 30-day window, track the percentage of requests that violate the target. When your error budget is nearly exhausted, it is time to investigate, not after it is fully burned.
- Set up alerting. Configure alerts that fire when your rolling SLO compliance drops below a threshold (e.g., alert when compliance falls below 97% over a 1-hour window). This gives you early warning before the monthly error budget is fully consumed.
- Review and adjust quarterly. Provider performance changes as they scale infrastructure, update models, and shift routing. Your SLO targets should evolve with the data. Tighten targets as your architecture improves; loosen them temporarily if you migrate to a new model that trades latency for quality.
The SLO Definition Checklist
Use this checklist for every LLM-powered feature before it ships to production:
Your progress is saved automatically in your browser.
Monitoring SLOs in Practice
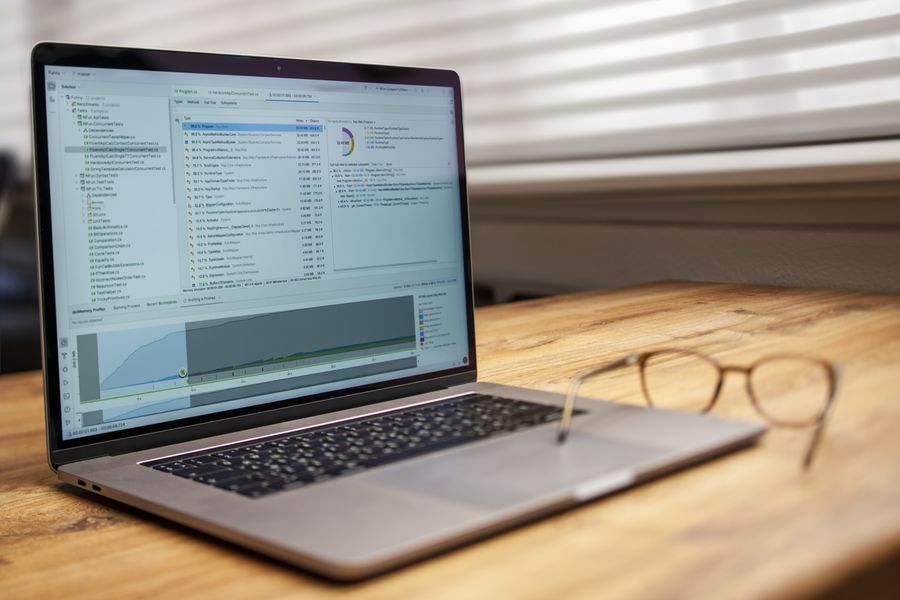
Defining an SLO on paper is the easy part. Keeping it honest requires continuous measurement from outside your own infrastructure. There are three layers of monitoring you should combine:
Application-level instrumentation
Add timing code around every LLM API call in your backend. Log the provider, model, region, TTFB, TTFT, TCT, HTTP status code, and token counts. This gives you the richest data but only covers traffic your application actually generates, it will not catch provider degradation during low-traffic hours.
Synthetic probing
Synthetic probes send standardized requests to the LLM API at regular intervals from fixed locations, regardless of your application traffic. This is how you detect degradation at 3 AM on a Sunday before Monday morning users hit it. Observinio runs daily probes from 21 regions against OpenRouter and OpenAI direct endpoints, comparing each measurement against historical baselines to flag regressions automatically.
Provider status pages
Check the provider's own status page, but do not rely on it exclusively. Provider status pages typically report outages but rarely surface latency degradation. They are useful for confirming a known incident, not for detecting one.
The combination of application instrumentation (real user traffic) and synthetic probing (consistent baseline) gives you both depth and coverage. When your application metrics show a latency spike, cross-reference with synthetic probe data: if the probes also show degradation, the problem is on the provider side. If only your application metrics are affected, look at your own infrastructure first.
Common Mistakes When Setting LLM Latency SLOs
Avoid these pitfalls that trip up even experienced platform teams:
- Using averages instead of percentiles. A p50 of 400 ms can hide a p99 of 8 seconds. Always define SLOs at p95 or p99.
- Ignoring prompt length variation. A 100-token prompt and a 4,000-token prompt will have very different TTFT values on the same model. Segment your SLOs by prompt-size bucket if your feature has high variance.
- Setting one global target for all regions. As discussed above, physics makes this unrealistic. Either set per-region targets or invest in regional routing.
- Forgetting about cold starts and model loading. Some providers load models on demand. The first request after an idle period can be 5–10× slower. Your SLO should account for this or your architecture should include keep-alive probes.
- Not tracking the SLO over time. An SLO without a dashboard and a regular review meeting is just a number in a document. Treat it as a living metric.
Key takeaway: Define separate latency SLOs for TTFB, TTFT, and TCT at the p95 level, segment them by region and model, and monitor continuously with both application instrumentation and synthetic probes so you catch degradation before your users do.
Frequently Asked Questions
Start Tracking Your LLM Latency Baselines
Defining an SLO is only meaningful if you have reliable, multi-region latency data to measure against. Observinio monitors OpenRouter and OpenAI endpoints from 21 global regions with daily probes, compares results against historical baselines, and sends you email alerts when degradation occurs. Check the live status page to see current latency data, or get in touch to start receiving weekly latency summaries for the providers and regions that matter to your product.
Additional Resources
- What Is LLM Observability and Monitoring? - Honeycomb - Latency and performance: track how long requests take, where the bottlenecks occur, and how the system scales under load
- Granular LLM Monitoring for Tracking Token Usage and ... - This detailed data allows you to define and track specific SLOs for latency (e.g., "99% of summarization requests under 2 seconds"). Specialized LLM ...
- What is LLM monitoring? (Quality, cost, latency, and drift in ... - Latency metrics indicate how quickly a system responds to user requests.