
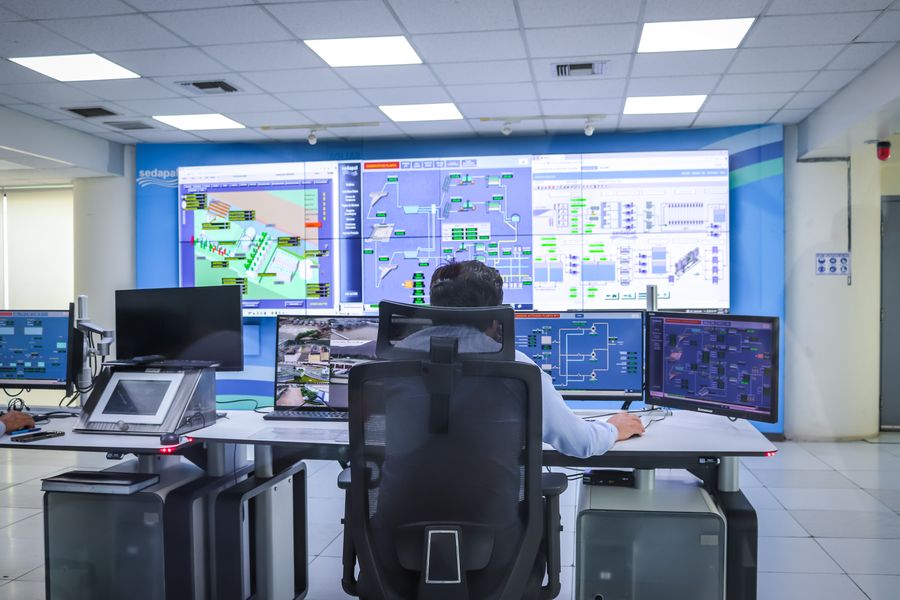
Photo by Airam Dato-on from Pexels
Your production chat feature just started timing out, Slack is lighting up, and the first thing you type into a search bar is "Is ChatGPT down?" You are not alone, that query spikes every time OpenAI experiences even partial degradation. But refreshing a status page and hoping for the best is not a monitoring strategy. This article walks you through how to detect, verify, and respond to OpenAI outages before your users notice them.
TL;DR
- OpenAI's official status page is useful but often lags behind real-world degradation by minutes or more.
- Relying on a single check from one region misses partial outages that only affect specific geographies.
- Synthetic probes that measure TTFB and TTFT from multiple regions give you the earliest signal.
- Automated alerts tied to latency baselines beat manual page-refreshing every time.
- Observinio monitors OpenAI (and OpenRouter) endpoints from 21 global regions and sends degradation alerts before status pages update.
Why "Is ChatGPT Down?" Is the Wrong Question
When engineers ask "Is ChatGPT down?" they usually mean one of several very different things:
- Total outage, the API returns 5xx errors for every request globally.
- Partial degradation, some models or endpoints respond, but latency has doubled or tripled.
- Regional slowdown, requests from Europe time out while US-East works fine.
- Rate-limit squeeze, your specific org tier is throttled, but the service is technically "up."
status.openai.com is designed to communicate category one, full outages. It is updated manually or semi-automatically, and there is an inherent delay between the moment packets start dropping and the moment a status indicator turns yellow. For categories two through four, the page may never change color at all.
"Overall uptime typically exceeds 99.5% monthly.">, Is ChatGPT Down? How to Check OpenAI Status
That 99.5% sounds reassuring until you do the math: 0.5% downtime per month is roughly 3.6 hours. If those hours land during peak traffic for your product, the impact on user experience, and revenue, is significant. And that figure only counts full outages, not the slow responses that frustrate users just as much.
The Real Cost of Latency Spikes
For production LLM features, a response that takes 8 seconds instead of 2 seconds is functionally broken even though the API technically returned a 200. Users abandon chat interfaces when time-to-first-token (TTFT) exceeds their patience threshold, which research consistently places around 2–3 seconds for interactive applications. Monitoring only for HTTP errors misses the entire class of "it's up but unusable" incidents.
What the Official Status Page Actually Tells You
OpenAI's status page reports on a handful of service components: ChatGPT, the API, Labs, and the Playground. Each component shows one of three states, operational, degraded performance, or major outage. Here is what you can and cannot learn from it:
What it covers
- Confirmed global outages with timestamps.
- Scheduled maintenance windows.
- Post-incident summaries (usually published within 24–48 hours).
What it misses
- Regional variance. A slowdown affecting only
asia-southeast1will not appear if aggregate metrics stay within tolerance. - Model-specific issues. GPT-4o might be degraded while GPT-3.5-turbo responds normally; the page rarely breaks this out.
- Latency creep. A gradual increase from 1.2 s to 3.8 s TTFB over a few hours is invisible to a binary up/down indicator.
- Your specific traffic pattern. If you send large context windows or use function calling heavily, you may hit limits that lighter workloads do not.
| Detection Method | Full Outage | Partial Degradation | Regional Slowdown | Latency Creep |
|---|---|---|---|---|
| Official Status Page | ✅ (delayed) | ❌ | ❌ | ❌ |
| Downdetector / Social | ✅ (delayed) | ⚠️ Partial | ⚠️ Partial | ❌ |
| Multi-Region Synthetic Probes | ✅ Fast | ✅ Fast | ✅ Fast | ✅ Via baselines |
The takeaway: the status page is a useful secondary source, but it should never be your primary detection mechanism.
How to Monitor OpenAI Status the Right Way

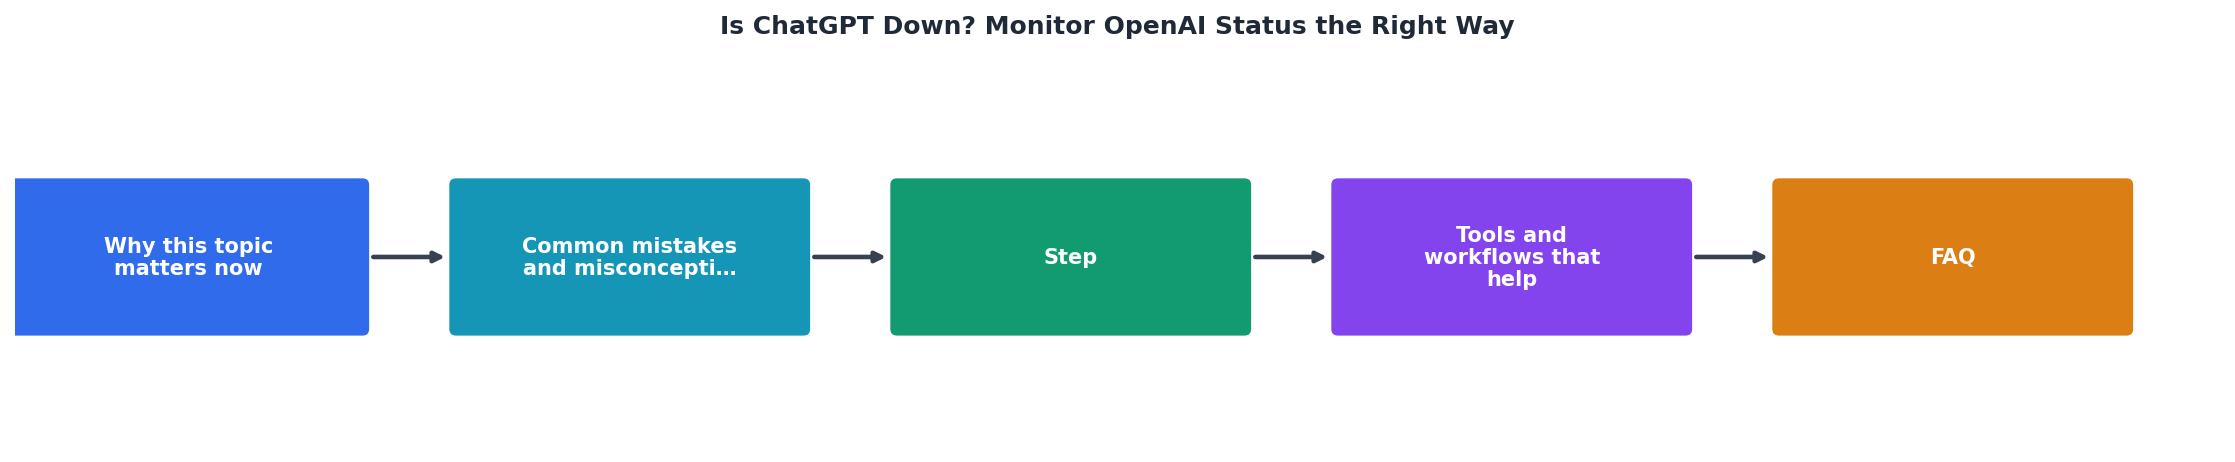
A proper monitoring setup for any external API, especially one as critical as OpenAI, combines synthetic probes, baseline comparison, and multi-region coverage. Here is a step-by-step approach.
Step 1: Establish Latency Baselines
Before you can detect degradation, you need to know what "normal" looks like. Record TTFB and TTFT for the models and endpoints you use in production over at least one full week. Capture these metrics per region if your users are geographically distributed. A baseline built from a single data center in Virginia will not help you spot a slowdown in Frankfurt.
Step 2: Deploy Synthetic Probes from Multiple Regions
Synthetic probes send lightweight, standardized requests to the API at regular intervals, independent of your production traffic. This gives you a clean signal that is not muddied by your own application logic, queue depth, or retry behavior.
Key parameters to configure:
- Probe interval: Every 5–15 minutes is a reasonable starting point. More frequent probes give faster detection but consume more API credits.
- Regions: Cover every geography where you have significant user traffic. At minimum, include US-East, US-West, EU-West, and one Asia-Pacific location.
- Payload: Use a small, deterministic prompt so that response-time variance reflects the provider, not token-count differences.
Step 3: Set Threshold-Based Alerts
Define alert thresholds relative to your baselines, not as absolute numbers. A rule like "alert when TTFB exceeds 2× the 7-day rolling median for this region" adapts to natural fluctuations and avoids false positives from one-off slow responses.
Useful alert tiers:
- Warning: TTFB exceeds 1.5× baseline for two consecutive probes.
- Critical: TTFB exceeds 3× baseline or HTTP error rate exceeds 5% over a 15-minute window.
- Regional divergence: One region's latency deviates more than 2× from the global median, suggesting a localized issue.
Step 4: Correlate with the Official Status Page
Subscribe to OpenAI's status page RSS feed or webhook so that when they do confirm an incident, you can automatically annotate your own dashboards. This creates a timeline that shows: (a) when your probes first detected the problem, (b) when the status page acknowledged it, and (c) when your probes confirmed recovery.
Step 5: Review Weekly Trends
Incident response is reactive. Weekly trend reviews are proactive. Look for:
- Gradual baseline drift (latency creeping up week over week).
- Recurring time-of-day patterns (e.g., slowdowns during US business hours).
- Model-specific regressions after provider updates.
A Practical Monitoring Checklist
Use this checklist to audit your current OpenAI monitoring setup:
Your progress is saved automatically in your browser.
Regional Latency: The Hidden Variable

One of the most underappreciated aspects of LLM API reliability is regional variance. OpenAI's infrastructure is not uniformly distributed, and network paths from different parts of the world introduce wildly different latency profiles. A request originating in São Paulo may consistently take 400–600 ms longer than the same request from Virginia, and during a partial outage, that gap can widen to seconds.
This matters for two reasons:
- User experience is local. Your P95 latency metric averaged across all regions hides the fact that users in a specific market are having a terrible time.
- Incident scoping is faster. When your probes show degradation in
eu-west-1andeu-central-1but normal performance inus-east-1, you can immediately narrow the investigation to a regional routing or peering issue rather than assuming a global outage.
Beyond OpenAI: Monitoring Through Routing Layers
Many production systems do not call OpenAI directly. They route through aggregators like OpenRouter, which adds another layer of potential latency and failure modes. A slowdown might originate at OpenAI, at the routing layer, or in the network path between them. Without probes on both the direct endpoint and the routing layer, you cannot isolate the source.
This is why comparing latency across providers and routing paths is essential. If OpenAI direct shows normal TTFB but OpenRouter shows elevated latency for the same model, the issue is in the routing layer, and your response should be different (switch to direct calls) than if OpenAI itself is degraded (switch to a fallback model or provider).
You can explore provider-specific latency data on the Observinio OpenRouter provider page to see how routing-layer performance compares to direct API calls across regions.
Frequently Asked Questions
Start Monitoring Before the Next Outage
The next time OpenAI experiences degradation, you want to be the person who already knows, not the one frantically Googling "Is ChatGPT down?" Set up multi-region synthetic probes with baseline-relative alerts, and you will detect issues minutes before the status page catches up. Observinio's daily probes across 21 regions with automatic degradation alerts and weekly latency summaries give you exactly that visibility, no custom infrastructure required. Check out the status dashboard or get in touch to see how your current provider latency stacks up.
Additional Resources
- OpenAI Status - We're not aware of any issues affecting our systems. System status. May 2026-Aug 2026. APIs. 12 components. 99.94 % uptime. APIs. 12 components. ChatGPT.
- OpenAI down? Current problems and outages - OpenAI User reports show no current problems with OpenAI solutions including ChatGPT for conversational AI, Most reported problems 84% ChatGPT 7% Codex 5% App
- Is ChatGPT Down? How to Check OpenAI Status - 4 Reliable Ways to Check ChatGPT Status · 1. API Status Check (Fastest Method) · 2. OpenAI Official Status Page · 3. Downdetector Community Reports.