
Photo by Airam Dato-on from Pexels
You are staring at a spinning cursor in your production dashboard. Requests to the OpenAI API are timing out, your Slack channel is lighting up, and the first thing you do is open a browser tab and type "Is ChatGPT down?" You are not alone, millions of developers and platform engineers do the same thing every week. The problem is that by the time you confirm the outage through social media or a status page refresh, your users have already felt the pain. There is a better way: continuous, region-aware latency monitoring that tells you about degradation before your customers notice it.
TL;DR
- OpenAI's official status page is useful but often lags behind real-world degradation by minutes or even hours.
- Relying on Twitter, Reddit, or DownDetector gives you anecdotal signal, not actionable data.
- Synthetic probes running from multiple global regions catch regional slowdowns that aggregate dashboards miss entirely.
- Baseline comparison is the key: you need to know what "normal" looks like for each model endpoint in each region before you can detect "abnormal."
- Automated alerts tied to latency thresholds let you start incident response before the first support ticket arrives.
Why "Is ChatGPT Down?" Is the Wrong Question
The question itself reveals a gap in observability. "Down" implies a binary state, working or broken. In practice, OpenAI API degradation is almost never binary. What you actually experience is a spectrum: slightly elevated Time to First Byte (TTFB), increased Time to First Token (TTFT), intermittent 429 rate-limit responses, or partial failures isolated to specific models or regions. A request to gpt-4o might complete in 800 ms from us-east-1 while the same request takes 4.2 seconds from eu-west-1. Neither scenario registers as "down" on a status page, yet the European users of your product are having a terrible experience.
The real questions you should be asking are far more specific: What is the current P95 TTFT for gpt-4o from my primary serving region? Has latency drifted more than 20% above the seven-day baseline? Are other regions affected, or is this isolated? These are the questions that lead to actionable incident response rather than anxious guessing.
Key takeaway: "Down" is almost never binary for AI APIs. Replace the yes-or-no question with continuous, region-aware latency measurement so you detect degradation before your users do.
The Limits of Official Status Pages

OpenAI maintains a public status page at status.openai.com. It is a reasonable starting point, but it has structural limitations that make it insufficient as your only monitoring signal:
- Update lag. Status pages are typically updated manually or semi-automatically. There is an inherent delay between when degradation begins and when the status changes from "Operational" to "Degraded Performance." During that window, your application is already suffering.
- Aggregate perspective. The status page reports from OpenAI's vantage point, not yours. If the issue is network-path-specific or region-specific, it may never appear on the page at all.
- Model granularity. A single "API" component on the status page covers dozens of model endpoints. Degradation on
gpt-4ocompletions does not necessarily affectgpt-3.5-turboembeddings, but the status page rarely distinguishes between them at that level. - No historical baseline. The page tells you the current state. It does not tell you whether today's 1.1-second median TTFT is normal or 40% above the weekly average.
What Proactive Monitoring Looks Like
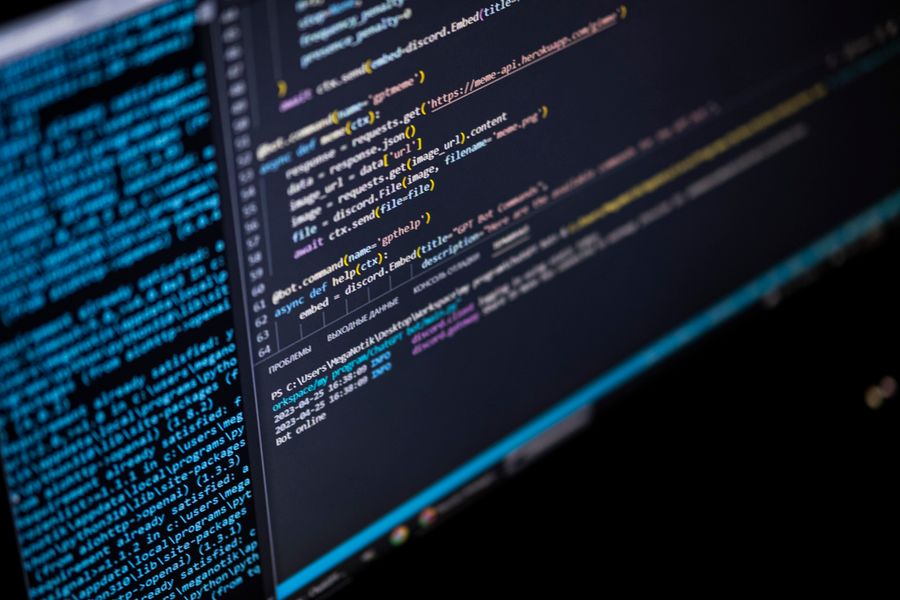
Proactive monitoring replaces the "is it down?" panic with a continuous data stream. The core idea is simple: send lightweight synthetic requests to the API at regular intervals from multiple geographic locations, measure the response characteristics, compare them against established baselines, and alert when thresholds are breached.
Key Metrics to Track
- TTFB (Time to First Byte): How long until the first byte of the HTTP response arrives. This captures network latency plus server processing queue time.
- TTFT (Time to First Token): For streaming completions, how long until the first token is generated. This is the metric your users actually feel, it is the delay before text starts appearing.
- Total response time: End-to-end duration of the full completion. Important for non-streaming use cases and batch workloads.
- Error rate: Percentage of requests returning 4xx or 5xx status codes. A spike in 429s (rate limiting) or 503s (service unavailable) is an early degradation signal.
- Regional variance: The difference in any of the above metrics across geographic probe locations. A 300% TTFT increase in Asia-Pacific while North America stays flat is a regional incident, not a global outage.
Why Baselines Matter More Than Absolute Numbers
A TTFT of 1.5 seconds might be perfectly normal for gpt-4o with a 2,000-token prompt, or it might be double the usual value for a 50-token prompt. Without a rolling baseline, typically computed over seven to fourteen days of probe data, you cannot distinguish normal variance from genuine degradation. Effective monitoring compares each new measurement against the baseline for that specific model, region, and time-of-day window.
"The island is used by the Revolutionary Guards to monitor vessel traffic and sits in a strategic position overlooking the waterway, one of the world's most important shipping routes.">, IS Definition & Meaning
Just as strategic positioning enables effective physical monitoring of critical routes, strategic placement of synthetic probes across global regions enables effective digital monitoring of critical API pathways. The principle is the same: you need eyes where the traffic flows.
Step-by-Step: Setting Up OpenAI Latency Monitoring
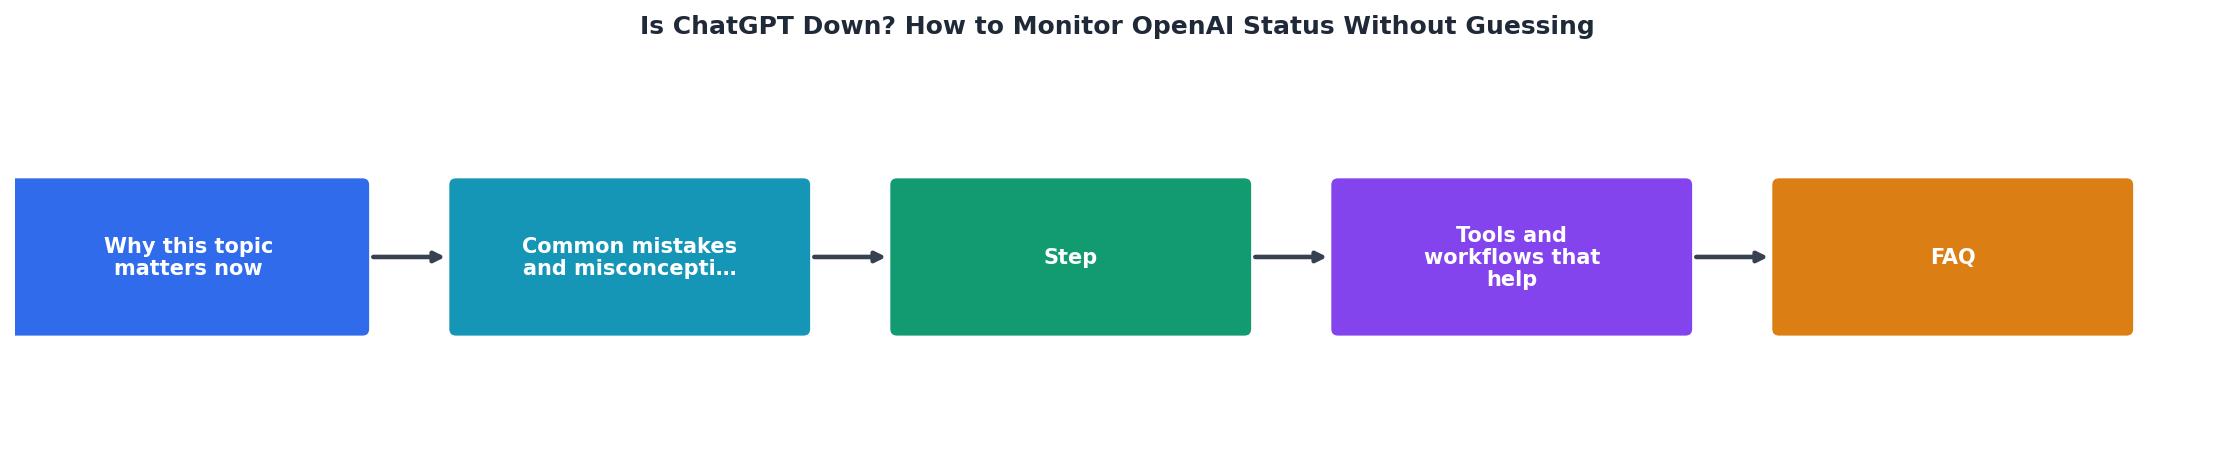
Follow these steps to move from reactive guessing to proactive, data-driven monitoring:
- Identify your critical endpoints. List every OpenAI model your application calls in production. For most teams this includes
gpt-4o,gpt-4o-mini, and possibly embedding models liketext-embedding-3-small. Each endpoint needs its own monitoring target because performance characteristics differ significantly between models.
- Determine your serving regions. Where are your users? If you serve a global audience, you need probe coverage in at least North America, Europe, and Asia-Pacific. If your user base is concentrated in one region, you still benefit from a secondary region as a control group to distinguish provider-side issues from network-path issues.
- Establish baselines. Run probes for at least seven days before setting alert thresholds. This gives you a realistic picture of normal variance, including daily traffic patterns (OpenAI endpoints are typically slower during US business hours due to higher load).
- Set alert thresholds relative to baselines. A common starting point is to alert when TTFT exceeds 150% of the seven-day rolling median for a given region and model. Adjust based on your SLO requirements. Tighter thresholds (120%) catch more incidents but generate more noise; looser thresholds (200%) reduce noise but delay detection.
- Configure notification channels. Email alerts work for weekly summaries and non-urgent degradation. For production-critical services, integrate alerts into your existing incident management workflow, PagerDuty, Opsgenie, or a dedicated Slack channel.
- Review weekly trend reports. Even when nothing is actively broken, weekly latency summaries help you spot gradual drift. A model endpoint that gets 5% slower each week for a month has degraded 20% without ever triggering a single alert. Trend reports catch this.
- Use the data for provider decisions. If you route traffic through OpenRouter or use multiple providers, latency data from multiple regions gives you objective evidence for routing decisions. Instead of guessing whether direct OpenAI access is faster than OpenRouter for your use case, you have the numbers.
Building a Monitoring Checklist
Use this checklist to audit your current OpenAI API monitoring setup:
Your progress is saved automatically in your browser.
Understanding Regional Latency Variance
One of the most underappreciated aspects of OpenAI API performance is how dramatically it varies by region. OpenAI's inference infrastructure is not uniformly distributed. Requests originating from regions closer to their primary data centers (concentrated in the US) naturally experience lower network latency. But network latency is only part of the story, request routing, load balancing, and regional capacity allocation all contribute to the variance.
In practice, this means a platform team in Singapore might see TTFT values that are consistently 60–80% higher than what a team in Virginia observes for the same model and prompt. This is not an outage. It is the steady-state reality of the infrastructure. But if you do not have regional probe data, you might mistake this baseline difference for degradation, or worse, you might miss actual degradation in a high-latency region because you assume "it's always slow there."
Monitoring from 21 global regions, as Observinio does with daily probes against both OpenAI direct and OpenRouter endpoints, gives you the granularity to distinguish between "this region is always slower" and "this region just got significantly slower than its own baseline." That distinction is the difference between a false alarm and a real incident.
Frequently Asked Questions
status.openai.com typically updates within 15 to 45 minutes of a significant incident beginning. For partial degradation, elevated latency without full request failures, the delay can be longer, sometimes hours. This is not unusual for vendor status pages; the update process involves internal detection, verification, and communication steps. For production systems with tight SLOs, this lag is too long, which is why independent synthetic monitoring is essential.🚀 Stop refreshing status pages manually
Observinio monitors OpenAI and OpenRouter latency from 21 global regions every day, so you get alerted about degradation before your users notice it.
Check Live OpenAI Status →Stop Guessing, Start Measuring
The next time you feel the urge to search "Is ChatGPT down?", consider what that impulse really means: you lack real-time, region-specific latency data for the API your product depends on. Observinio's status page and automated degradation alerts are designed to answer that question before you even think to ask it. With daily probes from 21 global regions, baseline comparison for every model endpoint, and weekly summary emails, you get the data you need to respond to incidents in minutes, not after a round trip through Twitter and Reddit. Check out the Observinio dashboard to see current OpenAI and OpenRouter latency across all monitored regions.
Additional Resources
- IS Definition & Meaning - The meaning of IS is present tense third-person singular of be; dialectal present tense first-person and third-person singular of be; ...
- IS Definition & Meaning - IS definition: 3rd person singular present indicative of be. IS IS abbreviation information security. American abbreviation information security.
- This Is What the Meaning of “Is Is” Is | by Jack Shepherd - The use of the present indefinite “is” can imply a more or less permanent state of affairs or something that is currently ongoing and doesn't ...