
Photo by Markus Winkler from Pexels
When your LLM-powered chat feature starts responding 400 ms slower in Frankfurt than it did yesterday, you need to know before your users file support tickets. Observinio degradation alerts give you exactly that: an email notification the moment response times for a monitored AI API endpoint cross a meaningful threshold compared to its established baseline. In this guide, you will walk through every step required to subscribe to those alerts, understand what triggers them, and tune them so they surface real problems instead of noise.
TL;DR
- Observinio monitors OpenRouter and OpenAI direct endpoints from 21 global regions with daily synthetic probes and compares results against rolling baselines.
- Degradation alerts fire when TTFB or TTFT in any monitored region exceeds the baseline by a configurable margin, and they are delivered via email.
- Subscribing takes under two minutes: visit the status page, enter your email, confirm, and choose which providers and regions matter to you.
- Weekly summary emails give you a seven-day latency trend so you can spot gradual regressions, not just sudden spikes.
- Alerts include region, provider, model, measured latency, and baseline value, enough context to act without opening a dashboard first.
Why Proactive Degradation Alerts Matter for AI APIs

Traditional APM tools excel at monitoring your own infrastructure, but they treat third-party AI API calls as opaque HTTP requests. You see that a call to OpenRouter took 1.2 seconds, yet you cannot tell whether the slowdown lives in the provider's inference cluster, in the routing layer, or in the network path between your cloud region and the provider's edge. Worse, aggregate dashboards average latency across all regions, hiding the fact that Asia-Pacific users are experiencing twice the delay of North American users.
Proactive degradation alerts solve this by shifting the detection point outside your stack entirely. Observinio runs synthetic probes from 21 geographically distributed regions every day, measuring Time to First Byte (TTFB) and Time to First Token (TTFT) for each provider and model combination. Each probe result is compared against a rolling baseline built from historical data for that specific region-provider-model tuple. When the measured value exceeds the baseline by a statistically meaningful margin, an alert is generated and sent to every subscriber who has opted in for that provider.
This approach has three concrete advantages for platform engineers:
- Region-level granularity, You learn that
eu-west-1is degraded whileus-east-1is fine, which lets you reroute traffic surgically instead of failing over globally. - Baseline-relative thresholds, A 200 ms TTFB is normal for a large model but alarming for a small one. Baseline comparison eliminates the need to manually set static thresholds per model.
- Independence from your deployment, Because probes run from Observinio's infrastructure, you can distinguish provider-side degradation from issues in your own network or application code.
How Observinio's Alert Pipeline Works

Before you subscribe, it helps to understand what happens behind the scenes so you can interpret the alerts you receive.
Probe Execution
Every day, Observinio dispatches synthetic requests to each monitored endpoint (currently OpenRouter and OpenAI direct) from all 21 probe regions. Each request mirrors a realistic chat-completion call, a short system prompt plus a user message, so the measured latency reflects what a production application would experience. The probe records TTFB (time until the first byte of the HTTP response arrives) and TTFT (time until the first token of the streamed completion is emitted).
Baseline Calculation
For every unique combination of region, provider, and model, Observinio maintains a rolling baseline. This baseline is derived from recent historical probe data and accounts for normal day-to-day variance. The baseline is not a single number but a range: a central tendency plus an acceptable deviation band. This means that a model that is inherently slower (for example, a large reasoning model) will have a wider acceptable range than a fast, small model.
Threshold Evaluation and Alert Dispatch
After each probe run, the system compares the fresh measurement against the baseline. If the measured TTFB or TTFT falls outside the acceptable range on the high side, the system marks that region-provider-model combination as degraded. It then sends an email alert to every subscriber who has opted in for that provider. The alert email contains:
- Provider and model, e.g., OpenRouter /
anthropic/claude-3.5-sonnet - Affected region, e.g.,
ap-southeast-1(Singapore) - Measured latency, the actual TTFB or TTFT value from the probe
- Baseline value, the expected range for comparison
- Timestamp, when the probe ran (UTC)
Step-by-Step: Subscribing to Degradation Alerts
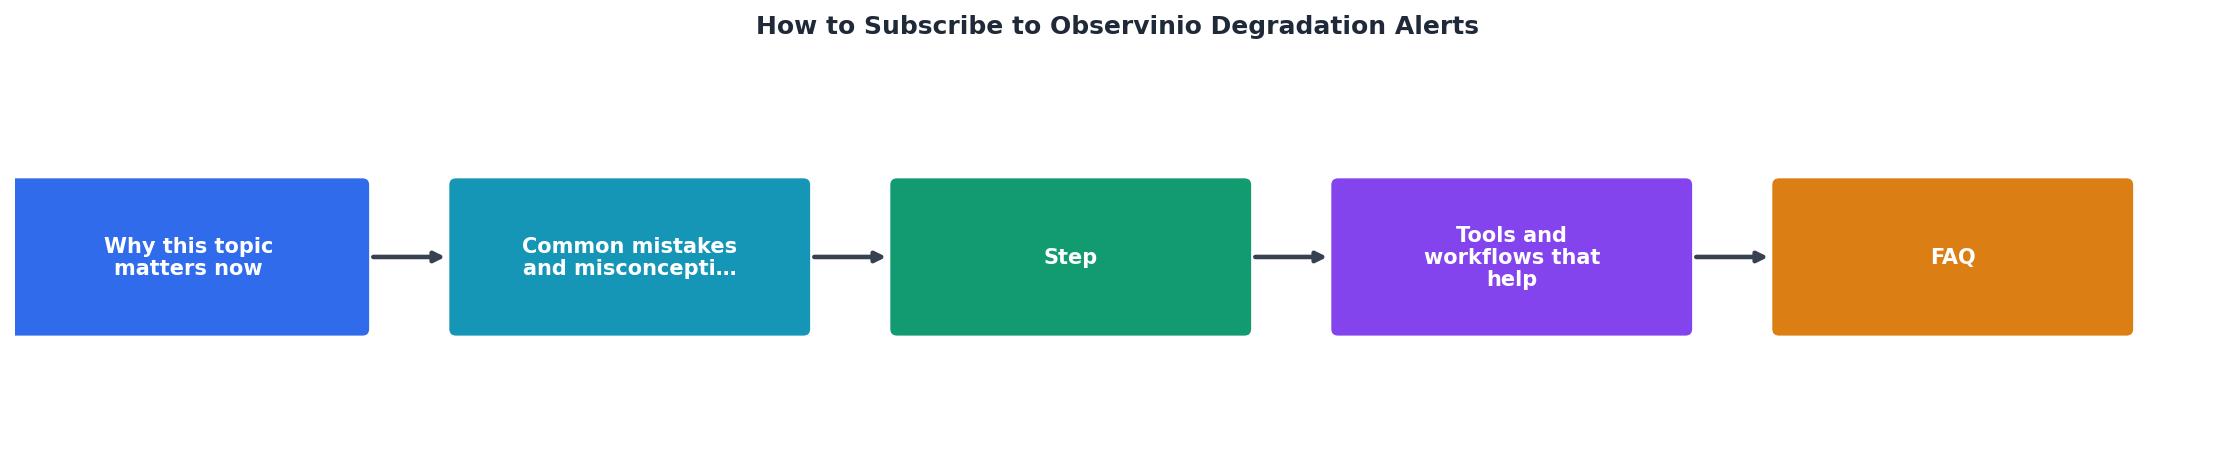
Follow these steps to start receiving alerts. The entire process takes less than two minutes.
- Navigate to the Observinio status page. Open observinio.com/status in your browser. This page shows the current latency status for all monitored providers and regions.
- Locate the subscription section. Below the live status grid, you will find a section labeled "Subscribe to Alerts." This is where you enter your email address.
- Enter your work email address. Type the email address where you want to receive degradation alerts. Use a team distribution list or a shared ops alias (e.g.,
platform-alerts@yourcompany.com) if you want the entire on-call rotation to receive notifications.
- Confirm your subscription. After submitting, check your inbox for a confirmation email from Observinio. Click the confirmation link to activate your subscription. This double opt-in step ensures that only valid, intentional subscribers receive alerts.
- Select your providers. Once confirmed, you can choose which providers you want alerts for. If your production stack only uses OpenRouter, there is no need to receive alerts about OpenAI direct endpoints, and vice versa. This keeps your inbox focused on signals that matter to your infrastructure.
- Verify with a test alert (optional). After subscribing, you can wait for the next daily probe cycle or check the status page to confirm your subscription is active. Your subscriber status will be visible in the confirmation email.
Subscribing Multiple Team Members
If your team has more than one person who needs to be in the loop, each person should subscribe individually with their own email address, or you can subscribe a shared mailing list. This is especially useful for teams that rotate on-call responsibilities, the shared alias ensures that whoever is on duty receives the alert without requiring individual subscription management.
Tuning Your Alert Experience

Subscribing is the first step, but getting value from alerts requires a bit of operational hygiene. Here is a checklist to make sure your alerts drive action rather than fatigue.
Alert Hygiene Checklist
Your progress is saved automatically in your browser.
Understanding Weekly Summaries vs. Degradation Alerts
It is important to distinguish between the two types of emails Observinio sends:
| Feature | Degradation Alert | Weekly Summary |
|---|---|---|
| Trigger | Probe detects latency above baseline | Scheduled every seven days |
| Content | Specific region, model, and measured value | Aggregated trends across all subscribed providers |
| Purpose | Immediate incident awareness | Long-term trend analysis and capacity planning |
| Action | Investigate and potentially reroute traffic | Review baselines, plan provider changes |
Both are valuable, but they serve different operational needs. Degradation alerts are your fire alarm; weekly summaries are your building inspection report.
Practical Example: Responding to a Degradation Alert
To make this concrete, here is a realistic scenario. Suppose you receive the following alert at 14:32 UTC:
Subject: [Observinio] Degradation detected, OpenRouter / anthropic/claude-3.5-sonnet

Region:        eu-central-1 (Frankfurt)
Provider:      OpenRouter
Model:         anthropic/claude-3.5-sonnet
Metric:        TTFT
Measured:      1,840 ms
Baseline:      920 ms (±150 ms)
Probe time:    2026-08-30T14:28:00Z
Your response playbook might look like this:
- Check the Observinio status page at /status to see whether other regions are also affected. If only
eu-central-1is degraded, the issue is likely regional. - Check your own APM for elevated latency on requests routed through Frankfurt. If your internal metrics confirm the slowdown, the problem is not a false positive from the synthetic probe.
- Decide whether to act. If Frankfurt serves a significant portion of your European traffic, consider temporarily routing those requests through
eu-west-1(Ireland) or switching to a different model that is not degraded. - Monitor for resolution. Keep an eye on the status page. Observinio will update the status when the next probe cycle shows latency returning to baseline.
- Log the incident. Even if the degradation resolves on its own, record it in your incident tracker. Over time, these records help you build a case for provider diversification or region-specific failover logic.
Observinio degradation alerts let you detect provider-side latency regressions before your users notice them, with region-level granularity and baseline-relative thresholds that eliminate manual tuning and false positives.
Integrating Alerts into Your Existing Workflow
Observinio alerts arrive via email, which makes them easy to integrate into virtually any workflow tool your team already uses:
- Slack / Microsoft Teams: Most team chat tools support email-to-channel integrations. Forward Observinio alerts to a dedicated
#ai-api-statuschannel so the whole team sees them in real time. - PagerDuty / Opsgenie: Create an email integration in your incident management platform. Observinio alerts can trigger pages during business hours or be routed to low-urgency queues overnight, depending on your escalation policy.
- Ticketing systems: Forward alerts to Jira, Linear, or your preferred tracker to automatically create investigation tickets when degradation is detected.
Frequently Asked Questions
Stay Ahead of Latency Regressions
If your production application depends on OpenRouter or OpenAI endpoints, waiting for user complaints to discover a slowdown is a losing strategy. Observinio degradation alerts give you an early-warning system that runs independently of your own infrastructure, covers 21 global regions, and delivers actionable context straight to your inbox. Head to the Observinio status page to subscribe in under two minutes, and start turning provider latency problems into proactive engineering decisions instead of reactive firefighting.