
Photo by rakhmat suwandi from Pexels
Every production system that depends on an external AI API, whether it is OpenAI directly or a routing layer like OpenRouter, needs a quantitative answer to one question: "What does normal look like?" Without a documented performance baseline, you cannot distinguish a genuine degradation from routine variance, and every latency spike turns into a fire drill. This guide walks you through the end-to-end process of collecting, calculating, and operationalizing baselines so your team can set meaningful SLOs, trigger alerts at the right thresholds, and make provider decisions backed by data instead of gut feeling.
TL;DR
- A performance baseline is a statistical snapshot of normal API behavior, typically p50, p95, and p99 latency, collected over a representative time window.
- You need region-specific baselines because a model that responds in 180 ms from
us-east-1may take 420 ms fromap-southeast-1. - Collect at least seven full days of probe data before declaring a baseline valid; weekday and weekend traffic patterns differ.
- Refresh baselines on a rolling schedule (every two to four weeks) to account for provider-side model updates and infrastructure changes.
- Automated alerts that compare live measurements against your baseline thresholds cut mean-time-to-detect (MTTD) from hours to minutes.
Why Baselines Matter More Than Raw Uptime

Uptime checks tell you whether an endpoint returns a 200 status code. They say nothing about whether the response arrived fast enough for your users. An AI chat completion endpoint can be "up" while delivering Time-to-First-Byte (TTFB) values three times higher than the previous week, and your uptime dashboard will stay green the entire time.
Baselines solve this by giving you a reference distribution. When today's p95 TTFB from Frankfurt is 640 ms and your baseline says the normal p95 is 310 ms, you have an objective, defensible signal that something changed. That signal can feed into an SLO burn-rate alert, an incident channel notification, or a weekly report to stakeholders who want to know whether the provider contract is delivering what was promised.
For ML platform engineers who own model routing, baselines also unlock comparative analysis. If you route traffic through OpenRouter and simultaneously probe the direct OpenAI endpoint, you can maintain separate baselines for each path and quantify the routing overhead per region. That data turns "should we go direct?" from a debate into a spreadsheet.
The cost of not having baselines
Without baselines, teams typically fall into one of two traps. The first is alert fatigue: thresholds are set too tight because nobody knows what normal variance looks like, so every minor fluctuation pages the on-call engineer. The second is silent degradation: thresholds are set too loose (or not set at all), and a 2× latency increase goes unnoticed for days until a customer complains. Both traps are expensive, the first burns out your team, the second burns your users' trust.
What to Measure: Key Metrics for AI API Baselines
Not every metric deserves a baseline. Focus on the signals that directly affect user experience and system reliability:
- Time-to-First-Byte (TTFB), The interval between sending the request and receiving the first byte of the response. For streaming chat completions, this is the most user-visible latency metric because it determines how quickly the first token appears on screen.
- Time-to-First-Token (TTFT), Similar to TTFB but measured at the application layer after parsing the SSE stream. In practice, TTFT is usually within a few milliseconds of TTFB, but proxy layers or custom middleware can introduce a gap worth tracking.
- Total Response Time (TRT), End-to-end duration from request sent to last byte received. Important for non-streaming use cases like embeddings or single-shot completions.
- Error Rate, Percentage of requests returning 4xx or 5xx status codes. A baseline error rate of 0.2 % lets you alert when it crosses 1 % rather than guessing.
- Regional Variance, The difference in any of the above metrics across geographic regions. A model served from US data centers will inherently have higher latency when probed from Asia-Pacific. Baselines must be region-specific to be useful.
Step-by-Step: Building Your First Baseline
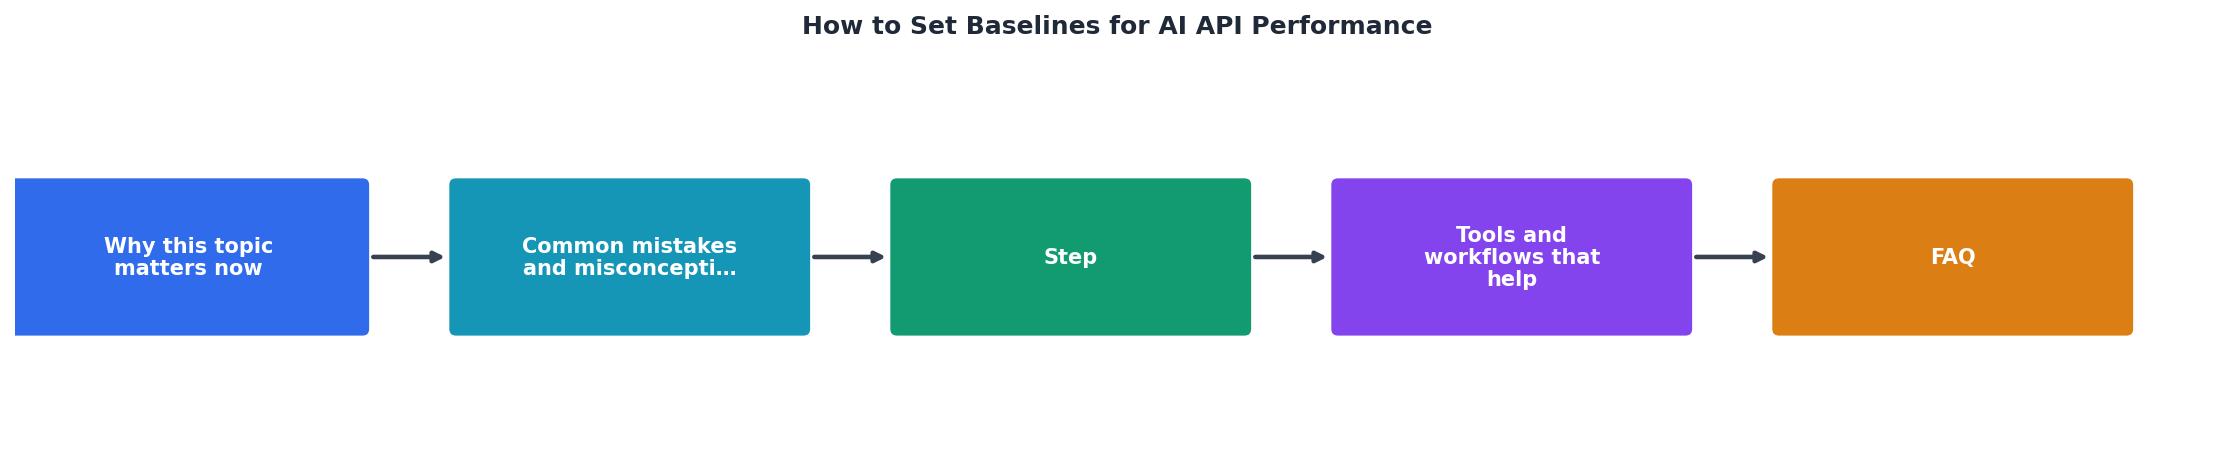
"The following diagram illustrates the complete workflow for performance baseline testing:.">, How to Create Performance Baseline Testing
Follow these steps to go from zero to a production-ready baseline. The process assumes you have access to a synthetic probing tool, either a custom script or a service like Observinio that already runs daily probes from 21 regions.
Step 1: Define the scope
Decide which endpoints, models, and regions matter for your product. A typical scope statement looks like this:
- Endpoints: OpenAI
chat/completions(direct), OpenRouterchat/completions - Models:
gpt-4o,claude-sonnet-4 - Regions:
us-east-1,eu-west-1,ap-northeast-1(match your user base) - Metrics: TTFB p50 / p95 / p99, error rate
Step 2: Configure synthetic probes
Synthetic probes send a standardized request at regular intervals, independent of real user traffic. This isolation is critical, you want to measure the provider's performance, not the variance introduced by different prompt lengths or token counts in production.
A minimal probe configuration:
{
  "endpoint": "https://api.openai.com/v1/chat/completions",
  "model": "gpt-4o",
  "messages": [
    {"role": "user", "content": "Respond with exactly one word: hello."}
  ],
  "max_tokens": 5,
  "stream": true,
  "interval_minutes": 60,
  "regions": ["us-east-1", "eu-west-1", "ap-northeast-1"]
}
Keep the prompt short and deterministic. You are measuring infrastructure latency, not model reasoning time. Setting max_tokens low ensures the response completes quickly and total response time stays dominated by network and inference startup costs.
Step 3: Collect data for at least seven days
Seven days captures weekday/weekend patterns and at least one provider maintenance window. If your product has strong weekly seasonality (e.g., enterprise tools used Monday–Friday), consider extending to fourteen days. During this collection window, do not change probe configuration, consistency is essential.
Step 4: Calculate percentile baselines
Once you have seven days of data, compute per-region percentiles. Here is a quick Python snippet using NumPy:
import numpy as np

latencies_ms = load_probe_data(region="eu-west-1", days=7)

baseline = {
    "p50": np.percentile(latencies_ms, 50),
    "p95": np.percentile(latencies_ms, 95),
    "p99": np.percentile(latencies_ms, 99),
    "sample_count": len(latencies_ms),
}
print(baseline)
Store the output alongside metadata: date range, model, endpoint, and region. This record becomes your audit trail when you refresh baselines later.
Step 5: Set alert thresholds relative to the baseline
A common starting point:
| Alert level | Condition | Example (if p95 baseline = 300 ms) |
|---|---|---|
| ⚠️ Warning | Current p95 > 1.5 × baseline p95 | > 450 ms |
| 🔴 Critical | Current p95 > 2.0 × baseline p95 | > 600 ms |
| 🚨 Emergency | Current p95 > 3.0 × baseline p95 | > 900 ms |
Adjust multipliers based on your SLO. A real-time voice application needs tighter thresholds than a batch summarization pipeline.
Step 6: Schedule baseline refresh
Provider infrastructure changes constantly, model version bumps, new hardware rollouts, routing algorithm updates. A baseline older than four weeks may no longer represent "normal." Set a calendar reminder or automate a rolling recalculation every two to four weeks.
Monitoring Baselines Across Regions
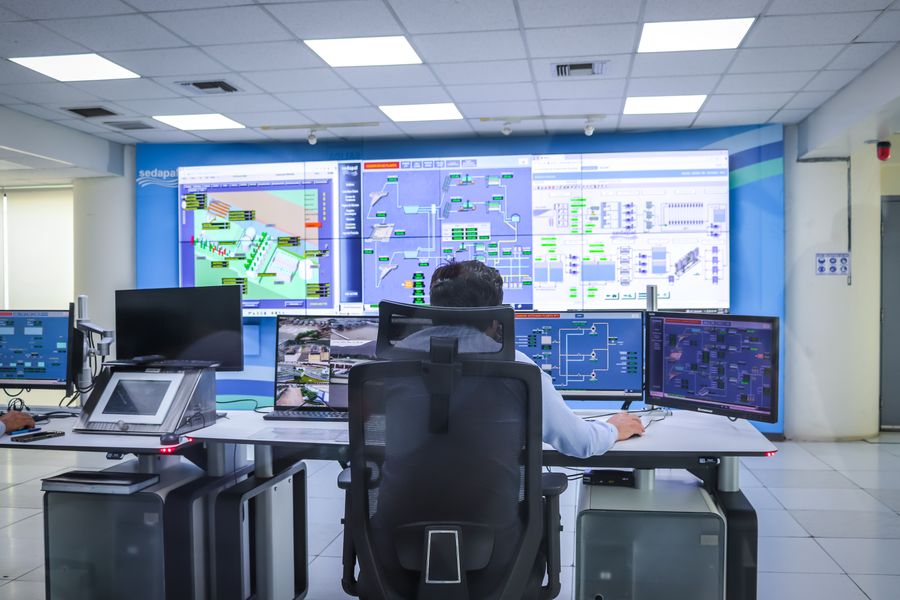
Regional variance is one of the most underestimated factors in AI API performance. A single global baseline masks the reality that users in São Paulo and users in Tokyo experience fundamentally different latency profiles. When Observinio probes an endpoint from 21 regions daily, it surfaces these differences automatically, but even if you run your own probes, the principle is the same: one baseline per region, per endpoint, per model.
Practical checklist for regional baselines
Your progress is saved automatically in your browser.
When regional baselines diverge
If your Frankfurt baseline suddenly jumps from 280 ms (p95) to 520 ms while all other regions stay flat, you are likely looking at a regional infrastructure issue on the provider side, not a model degradation. This distinction matters for incident response: a regional problem may warrant failover to a different provider or region, while a global slowdown suggests a model-level change that failover will not fix.
Common Mistakes to Avoid
Even experienced teams stumble when setting baselines. Watch out for these pitfalls:
- Using averages instead of percentiles. An average of 200 ms can hide a p99 of 1,800 ms. Always baseline on percentiles.
- Mixing probe configurations. If you change the prompt, token limit, or streaming setting mid-collection, your data is contaminated. Start the seven-day window over.
- Ignoring time-of-day patterns. Some providers show higher latency during US business hours due to load. If your baseline window only covers off-peak hours, your thresholds will be too tight during peak.
- Setting it and forgetting it. A baseline from three months ago is archaeology, not monitoring. Automate refresh cycles.
- Baselining only one provider path. If you use OpenRouter as your primary and OpenAI direct as your fallback, baseline both. A fallback you have never measured is a fallback you cannot trust.
Frequently Asked Questions
gpt-4o), expect your baseline to shift. The best practice is to flag the update date in your monitoring system, collect seven days of post-update data, and then compute a new baseline. During the transition window, widen your alert thresholds by 20–30 % to avoid false positives while the new baseline stabilizes.Start Tracking Your Baselines Today
Setting baselines is not a one-time project, it is an ongoing practice that compounds in value as you accumulate historical data. If you do not yet have synthetic probes running across multiple regions, Observinio can help: it monitors OpenRouter and OpenAI endpoints from 21 global regions daily, compares live measurements against your baselines, and sends email alerts when latency degrades beyond your thresholds. Check the status page to see current provider performance, or visit the OpenRouter provider page to explore regional latency data. Weekly summary emails keep your team informed without requiring anyone to stare at a dashboard.
Additional Resources
- How to Create Performance Baseline Testing - Baseline Establishment Methodology · 1. Define Your Metrics · 2. Establish Controlled Test Conditions · 3. Collect Multiple Samples.
- Baseline - Set up baseline performance. Ensure training data is appropriately. If using Fiddler, define a pre-production baseline. Set drift thresholds and monitor ...
- How can I set Xcode performance test baselines on a CI ... - Xcode performance tests written with the XCTest.measure() API pass or fail depending on the "baseline" performance which must be set ...