
Photo by Krakograff Textures from Pexels
Your on-call phone buzzes at 3 AM. The alert says "high latency on LLM endpoint." You open the dashboard, see a spike that already resolved, and go back to sleep, only to learn at standup that a real, sustained degradation hit your European users two hours later and nobody was paged. The problem is not that you lack alerts; it is that the alerts you have are noisy, region-blind, and routed to whoever happens to be on rotation instead of the engineer who actually owns the affected service.
TL;DR
- Most AI API alert setups generate thousands of notifications per week, but fewer than 3% require immediate action.
- Effective degradation alerts need three properties: regional specificity, baseline-aware thresholds, and ownership-based routing.
- Static latency thresholds miss slow-burn degradations; compare against rolling baselines instead.
- Route alerts by service ownership, not by on-call rotation alone, so the right engineer responds first.
- Observinio's daily probes from 21 regions and degradation email alerts give you the regional signal most APM tools miss.
Why Most AI API Alerts Fail

Traditional alerting was designed for infrastructure you control. You set a CPU threshold at 85%, a disk threshold at 90%, and a response-time threshold at 500 ms. When the metric crosses the line, someone gets paged. This model breaks down the moment you depend on a third-party LLM API for production traffic, for three specific reasons.
1. Aggregate Averages Hide Regional Pain
OpenAI and OpenRouter route requests through multiple data centers. A global p95 latency of 320 ms can mask the fact that requests from ap-southeast-1 are hitting 1,200 ms while us-east-1 sits comfortably at 180 ms. If your alert fires on the global aggregate, you either never see the regional spike or you see it too late, after users in Singapore have already experienced multiple timeouts. Platform engineers need per-region visibility, not a single number averaged across continents.
2. Static Thresholds Cannot Track Shifting Baselines
LLM API latency is not stationary. A model update, a provider-side scaling event, or even a change in prompt routing can shift your "normal" TTFB by 50–100 ms overnight. A static threshold of 400 ms that was sensible last month may now fire constantly after a legitimate baseline shift, or worse, it may never fire because the new baseline is already above the old threshold. You need alerts that compare current measurements against a rolling baseline, not a number someone hardcoded in a YAML file six months ago.
3. Wrong Engineer, Wrong Context
"Research shows teams receive over 2,000 alerts weekly, with only 3% needing immediate action, leading to missed critical alerts and prolonged outages.">, How to Reduce On
When every alert goes to the same on-call channel, the person who gets paged may have no context about the affected service. The on-call SRE sees "OpenRouter latency degraded" but does not know whether that impacts the chat feature, the summarization pipeline, or the internal RAG tool. They spend 15 minutes triaging before escalating to the ML platform engineer who could have diagnosed the issue in two minutes. Alert fatigue compounds the problem: after hundreds of low-signal notifications, engineers start ignoring pages entirely.
The Three Properties of Alerts That Work

An effective degradation alert for AI API latency must satisfy three criteria simultaneously. Miss any one of them and you are back to noise.
- Regional specificity. The alert must tell you where the degradation is happening, not just that it is happening. A spike in
eu-west-1is a different incident from a spike inus-west-2, with different root causes and different user impact. Observinio probes endpoints from 21 global regions daily, so each alert carries a region label from the start.
- Baseline-aware thresholds. Instead of a fixed millisecond value, the threshold should be expressed as a deviation from the recent baseline. For example: "alert when TTFB exceeds the 7-day rolling p50 by more than 40%." This approach adapts automatically when providers shift performance characteristics and avoids both false positives after a legitimate improvement and false negatives after a gradual degradation.
- Ownership-based routing. The alert must reach the engineer who owns the service consuming that specific API endpoint in that specific region. This means tagging alerts with service metadata and routing them through your existing escalation tool, whether that is PagerDuty, Opsgenie, or a simple email rule, to the right team.
Step-by-Step: Building an Alert Pipeline That Routes to the Right Person
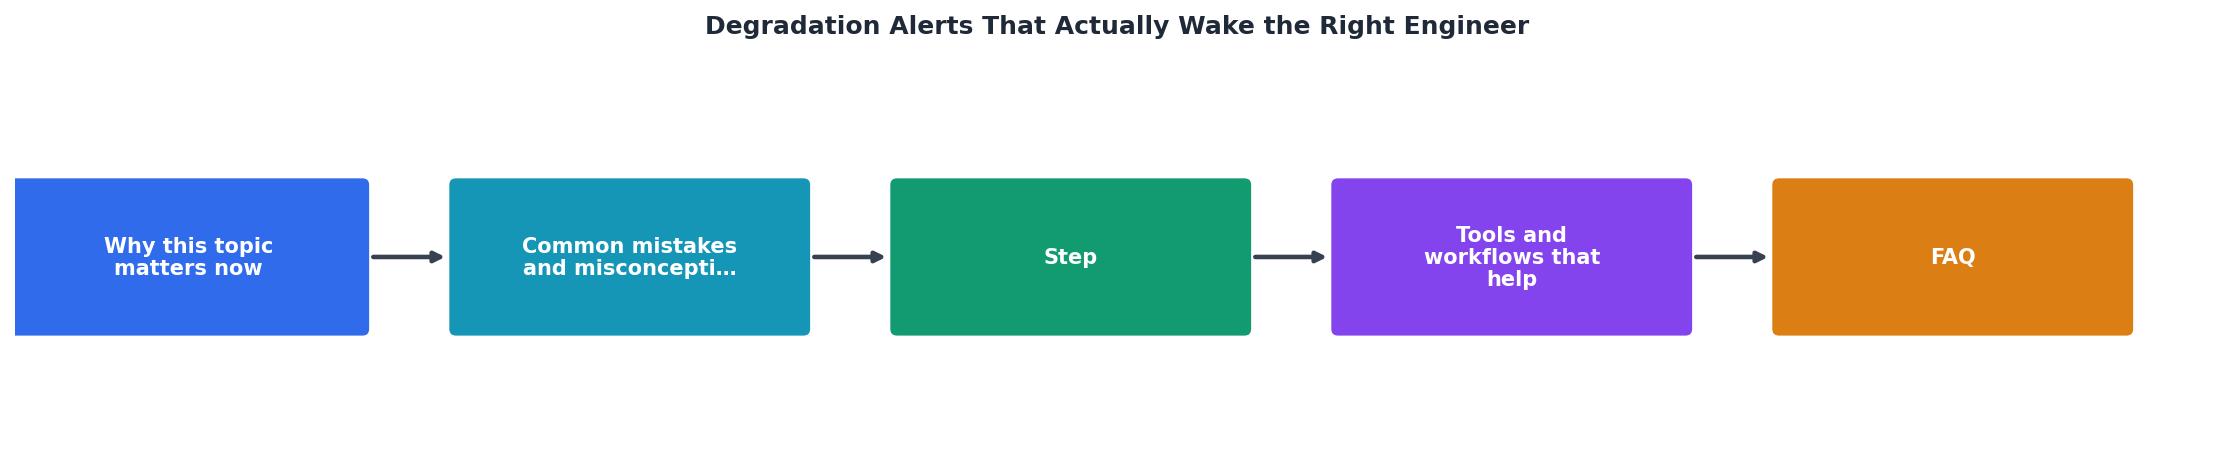
Follow these steps to move from noisy, catch-all alerts to targeted, actionable notifications.
Step 1: Inventory Your AI API Dependencies
List every external LLM endpoint your services call. For each one, record:
- The provider and model (e.g., OpenRouter →
anthropic/claude-3.5-sonnet, OpenAI direct →gpt-4o). - The regions your users connect from.
- The internal service that makes the call (e.g.,
chat-service,summarizer-worker). - The owning team and their preferred notification channel.
Step 2: Establish Regional Baselines
You cannot detect degradation without knowing what "normal" looks like per region. Use synthetic probes, either your own or a service like Observinio, to collect TTFB and TTFT measurements from each region at regular intervals. A minimum of seven days of data gives you a stable rolling baseline. Store the p50 and p95 for each region-model pair.
Step 3: Define Baseline-Relative Thresholds
Replace static thresholds with relative ones. A practical starting point:
- Warning: current p50 exceeds 7-day rolling p50 by more than 30%.
- Critical: current p50 exceeds 7-day rolling p50 by more than 60%, or current p95 exceeds 7-day rolling p95 by more than 50%.
Step 4: Tag and Route Alerts by Ownership
When an alert fires, enrich it with metadata from your inventory:
- Region where the probe detected the spike.
- Provider and model affected.
- Internal service that depends on this endpoint.
- Owning team and escalation path.
chat-service team uses a dedicated Slack channel and PagerDuty service, the alert goes there, not to the generic on-call rotation.
Step 5: Automate Suppression of Resolved Spikes
Short transient spikes (under two minutes) that self-resolve should not page anyone at 3 AM. Add a confirmation window: the alert only fires if the threshold is breached for two or more consecutive probe cycles. This single rule eliminates a large portion of false positives without delaying genuine incident detection by more than a few minutes.
Checklist: Audit Your Current Alert Setup
Use this checklist to evaluate whether your existing AI API alerts meet the bar:
Your progress is saved automatically in your browser.
If you checked fewer than five of these boxes, your alert pipeline has significant gaps that are likely contributing to alert fatigue or missed incidents.
Leveraging Weekly Summaries to Prevent Alert Drift

Alerts handle the acute case, something is broken right now. But slow-burn degradations that creep up by 10 ms per week will never cross a 40% threshold in a single day. This is where weekly latency trend reports become essential. By reviewing a weekly summary of p50 and p95 values per region, you can spot gradual regressions before they become incidents.
Observinio sends weekly summary emails that show exactly this: how each provider-region pair trended over the past seven days compared to the prior period. If eu-central-1 TTFB for OpenRouter has climbed 15% week-over-week for three consecutive weeks, that is a signal to investigate, even if no single-day alert ever fired. Treat the weekly summary as a planning input: adjust thresholds, re-evaluate provider choices, or open a conversation with your provider's support team armed with concrete, region-specific data.
Mapping Alerts to Incident Response
A well-routed alert is only valuable if the engineer who receives it knows what to do next. Pair each alert with a lightweight runbook entry that answers three questions:
- What is the blast radius? Which user-facing features depend on this endpoint in this region?
- What is the first diagnostic step? Check the Observinio status page for the provider, compare against other regions, and determine if the issue is provider-wide or region-specific.
- What is the mitigation path? Can you fail over to a different model, route traffic to a different region, or enable a cached fallback?
Key takeaway: Effective AI API degradation alerts require three properties working together: regional specificity so you know where the problem is, baseline-aware thresholds so you detect real regressions instead of noise, and ownership-based routing so the engineer with the right context responds first. Without all three, you are either drowning in false positives or missing real incidents entirely.
Frequently Asked Questions
Stop waking the wrong engineer
Observinio monitors your AI API endpoints from 21 global regions every day and sends degradation alerts with full regional context, so the right team gets notified before users complain.
Start monitoring for free View live status pageIf you are tired of alerts that wake the wrong person, or worse, alerts that never fire until users complain, take a look at Observinio's degradation alerts. Daily probes from 21 regions, baseline comparisons, and email notifications give you the regional specificity and signal clarity that generic monitoring tools miss. Check the live status page to see how your providers are performing right now.
Additional Resources
- How to Reduce On-Call Burnout in SRE Teams - On-call burnout happens when rotation design, alert hygiene and engineer readiness are all broken at once. Fixing it therefore requires ...
- Setting Up Alerts That Don't Wake You Up at 3 AM - 31% of engineers receive alerts multiple times per day, and most of them admit to ignoring alerts regularly. This is dangerous.
- Every on-call engineer knows alert fatigue. | Rex Sheridan - Every on-call engineer knows alert fatigue. It's 3 AM. Your pager goes off. You wake up, check the logs, and realize it's just a "disk usage ...