
Photo by Bálint Varga from Pexels
If you have ever noticed that the first request to an LLM API after a quiet period takes noticeably longer than subsequent ones, you have experienced a cold start. The difference between cold-start latency and steady-state latency can be dramatic, sometimes 3× to 10×, and it directly affects user-facing features like chat completions, search augmentation, and real-time agents. Understanding where that overhead comes from, how to measure it, and what you can do about it is essential for anyone running LLM-powered features in production.
TL;DR
- Cold-start latency occurs when provider infrastructure spins up idle resources (GPU instances, model weights loading, container initialization) to serve your first request after a period of inactivity.
- Steady-state latency is the baseline you see once the serving pipeline is warm, model weights are in GPU memory, KV caches are allocated, and connection pools are established.
- The gap between the two can range from hundreds of milliseconds to several seconds, depending on the provider, model size, and region.
- Synthetic probes sent at regular intervals (like Observinio's daily checks from 21 regions) help you distinguish cold-start spikes from genuine degradation.
- Architectural choices, keep-alive connections, warm-up requests, and multi-region routing, can reduce cold-start impact on end users.
What Exactly Is a Cold Start in LLM APIs?

A cold start happens when the infrastructure behind an API endpoint is not ready to serve inference immediately. In the context of LLM APIs, whether you call OpenAI directly or route through OpenRouter, several layers can contribute to cold-start overhead:
- Container or VM spin-up. Serverless GPU providers may deallocate instances after a period of zero traffic. The next request triggers a fresh allocation, which includes pulling the container image, initializing the runtime, and attaching GPU resources.
- Model weight loading. Large language models range from a few gigabytes (7B-parameter models) to hundreds of gigabytes (70B+ models). Loading these weights from storage into GPU VRAM is I/O-bound and can take seconds to tens of seconds on the provider side.
- KV cache and memory allocation. Inference engines like vLLM pre-allocate key-value cache blocks in GPU memory. This allocation step happens once at startup and adds measurable overhead.
- Connection establishment. TLS handshakes, HTTP/2 negotiation, and TCP slow-start all add latency on the very first request from a new client connection.
"The heatmap shows that at any given time, at least one CPU core reaches full (100%) utilization, indicating that vLLM continuously keeps one core saturated throughout the startup process.">, 1 Introduction
This quote illustrates just how resource-intensive the startup phase is. While the model loads, CPU cores are fully saturated orchestrating weight transfers, memory mapping, and initialization routines. None of that work produces tokens for your users, it is pure overhead.
Cold Start vs Steady State: The Numbers That Matter
In steady state, a well-provisioned LLM API endpoint typically delivers Time to First Byte (TTFB) in the range of 200–800 ms for medium-sized models, depending on region and load. During a cold start, that same TTFB can balloon to 2–15 seconds or more. The key metrics to track are:
- TTFB (Time to First Byte): How long until the first byte of the response arrives. Cold starts inflate this dramatically.
- TTFT (Time to First Token): For streaming endpoints, how long until the first generated token appears. This is what your users perceive as "thinking time."
- Total latency: End-to-end request duration. Cold starts affect this less proportionally for long completions, but short completions (single-sentence answers) can see 5–10× increases.
Why Cold Starts Hit Harder Than You Expect

Most teams look at average latency in their dashboards and see a reasonable number. The problem is that cold starts are tail-latency events, they show up in p95 or p99 percentiles and disproportionately affect specific user cohorts:
- First user of the day. If your product has low overnight traffic in a given region, the first morning user absorbs the cold-start penalty.
- Bursty workloads. Batch jobs or scheduled pipelines that run once per hour may hit a cold endpoint every single time.
- Multi-region deployments. A region with low traffic (say,
ap-southeast-1) may experience cold starts far more frequently thanus-east-1, even on the same provider. - Model switching. If you route different requests to different models via OpenRouter, each model may have its own cold-start behavior. A rarely-used model will almost always cold-start.
The Regional Dimension
Cold-start frequency varies significantly by region. Providers tend to keep more warm capacity in high-traffic regions (US East, EU West) and scale down aggressively in lower-traffic ones (South America, Southeast Asia, Middle East). This means your users in São Paulo or Singapore may consistently experience worse first-request latency than users in Virginia, not because of network distance, but because of infrastructure scaling policies.
This is precisely why monitoring from multiple geographic points matters. A single-region probe in us-east-1 will never catch the cold-start patterns your users in eu-central-1 or ap-northeast-1 experience. Observinio runs daily probes from 21 regions, which means cold-start events in any region are captured and compared against established baselines.
How to Measure and Distinguish Cold Starts

Measuring cold starts requires intentional test design. You cannot simply look at your application's APM traces and filter for slow requests, you need to know whether a slow request was slow because of a cold start or because of genuine provider degradation. Here is a practical approach:
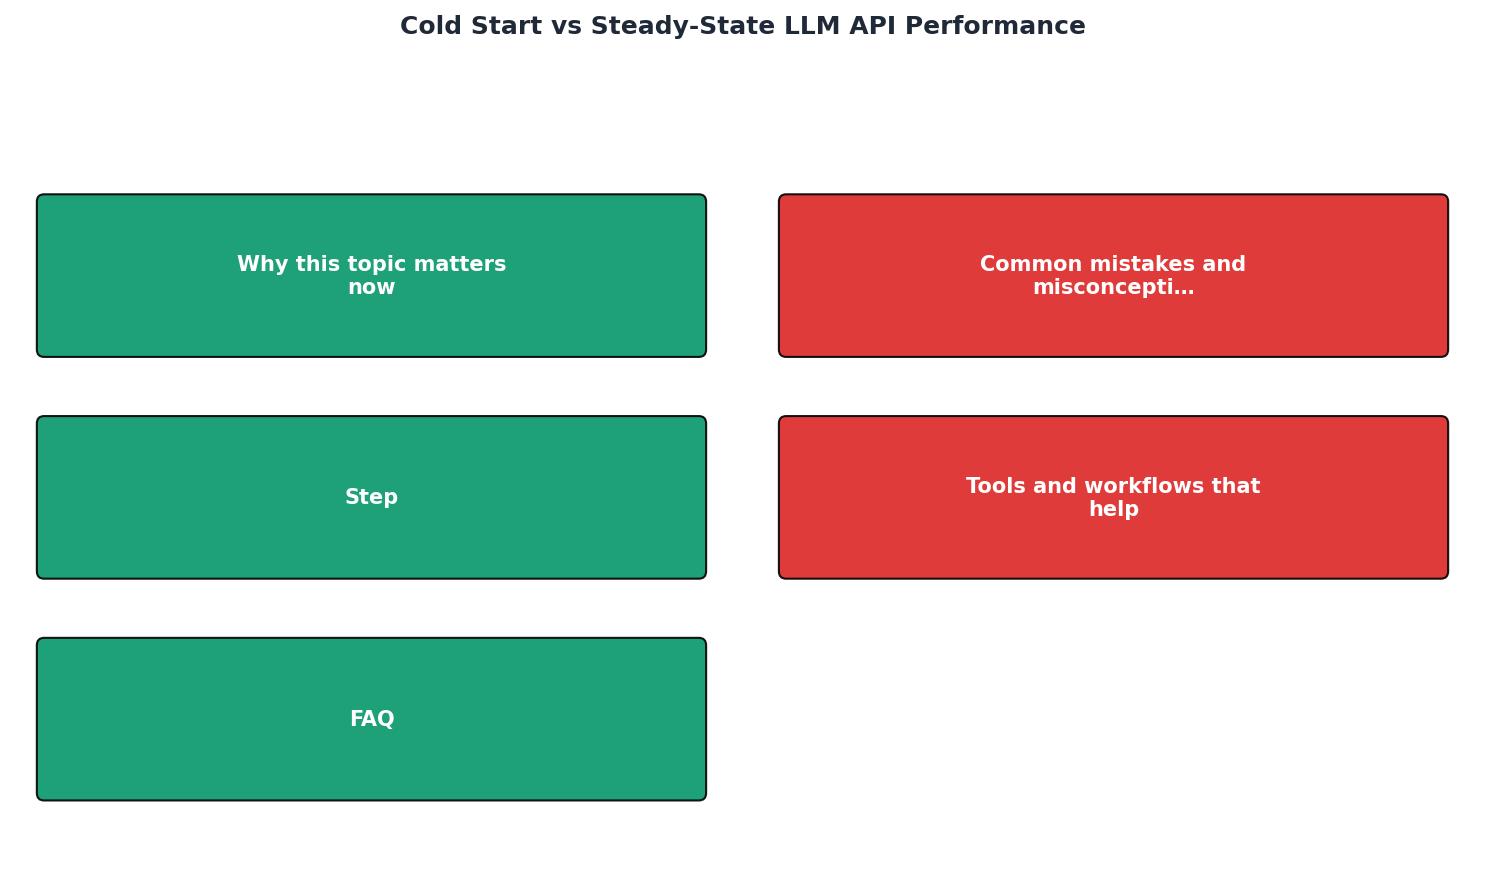
Step-by-Step: Cold-Start Measurement Protocol
- Establish a steady-state baseline. Send a burst of 5–10 identical requests to the target endpoint in quick succession. Discard the first response. Calculate the median TTFB and TTFT of the remaining responses, this is your warm baseline for that region and model.
- Wait for the cool-down period. Stop sending requests for a defined interval. Start with 15 minutes, then test 30 minutes, 1 hour, and 2 hours. The cool-down period at which latency spikes tells you the provider's scale-down threshold.
- Send a single probe request. After the cool-down, send exactly one request and record its TTFB and TTFT. This is your cold-start measurement.
- Compare against baseline. Calculate the cold-start penalty:
(cold_TTFB - baseline_TTFB) / baseline_TTFB × 100%. A penalty above 100% (i.e., more than 2× baseline) strongly suggests a cold start rather than normal variance. - Repeat across regions. Run the same protocol from multiple geographic locations. Use a tool that supports multi-region probing, or deploy lightweight scripts on cloud VMs in different regions.
- Log and trend over time. A single measurement is anecdotal. Track cold-start penalties daily over weeks to identify patterns, some providers show worse cold starts on weekends when they scale down more aggressively.
Sample Probe Script
Here is a minimal Python snippet you can use to measure cold-start vs steady-state TTFB against an OpenAI-compatible endpoint:
import time
import httpx

API_URL = "https://openrouter.ai/api/v1/chat/completions"
HEADERS = {
    "Authorization": "Bearer YOUR_API_KEY",
    "Content-Type": "application/json",
}
PAYLOAD = {
    "model": "openai/gpt-4o-mini",
    "messages": [{"role": "user", "content": "Say hello."}],
    "max_tokens": 10,
}

def measure_ttfb() -> float:
    """Send a single request and return TTFB in milliseconds."""
    start = time.perf_counter()
    with httpx.stream("POST", API_URL, headers=HEADERS, json=PAYLOAD,
                      timeout=30.0) as resp:
        # TTFB = time until first byte of response body
        next(resp.iter_bytes(chunk_size=1))
        ttfb = (time.perf_counter() - start)  1000
    return ttfb

warm_ttfbs = [measure_ttfb() for _ in range(3)]
baseline = sorted(warm_ttfbs)[1]  # median of 3

print(f"Baseline TTFB: {baseline:.0f} ms")
print("Waiting 30 minutes for cool-down...")
time.sleep(30  60)

cold_ttfb = measure_ttfb()
penalty = (cold_ttfb - baseline) / baseline * 100
print(f"Cold-start TTFB: {cold_ttfb:.0f} ms (penalty: {penalty:+.0f}%)")
This gives you a concrete, reproducible number. Run it from different machines or cloud regions to build a regional cold-start map.
Key takeaway: Always measure cold-start latency separately from steady-state latency. A single blended p99 metric hides the real experience of users who hit a cold endpoint, and without per-region probing you will never know which locations suffer the most.
Strategies to Mitigate Cold-Start Impact
Once you have measured the problem, here are practical ways to reduce its impact on your users:
Architectural Mitigations
- Keep-alive pings. Send a lightweight request (e.g., a 1-token completion) at regular intervals to prevent the provider from scaling down your allocated capacity. A request every 5–10 minutes is usually sufficient, but test against your provider's specific cool-down threshold.
- Connection pooling. Reuse HTTP/2 connections across requests. This eliminates TLS handshake overhead on subsequent calls. Libraries like
httpx(Python) orundici(Node.js) handle this natively when you use a persistent client instance. - Multi-provider failover. If your primary provider is cold, route to a secondary one that is warm. OpenRouter already does some of this internally, but you can add your own layer by checking TTFB against a threshold and falling back.
- Regional traffic shaping. If you know that
ap-south-1has frequent cold starts, route those users through a region with more consistent warm capacity, accepting slightly higher network latency in exchange for avoiding cold-start penalties.
Operational Mitigations
- Set separate SLOs for first-request and steady-state latency. A single p99 target that blends both will either be too lenient for steady state or impossible to meet during cold starts. Define something like: "Steady-state TTFT p99 < 800 ms; first-request TTFT p99 < 3 s."
- Alert on cold-start frequency, not just magnitude. A single cold start per day is normal. Ten cold starts per hour in the same region suggests the provider is thrashing, scaling down and up repeatedly.
- Track cold-start trends after provider updates. Providers regularly update their infrastructure. A model migration or infrastructure change can alter cold-start behavior without any announcement. Weekly latency summaries (like those Observinio sends via email) help you spot these shifts before they become user-visible problems.
Checklist: Cold-Start Readiness for Production LLM APIs
Use this checklist to audit your current setup:
Your progress is saved automatically in your browser.
Frequently Asked Questions
Start Tracking Cold Starts Across Regions
Cold-start behavior is invisible until you measure it from the places your users actually are. Observinio probes OpenRouter and OpenAI endpoints daily from 21 global regions, compares every measurement against established baselines, and sends you an email alert when latency degrades, whether from a cold start pattern or a broader incident. Check the live status page to see current regional latency, or get in touch to set up alerts for the models and regions that matter to your production traffic.
Additional Resources
- 1 Introduction - However, this fast evolution also complicates cold start optimizations, as prior techniques often become obsolete due to API changes or with the ...
- Cold Start Latency In LLM Inference: Causes, Metrics & Fixes - Cold start latency is a deployment bottleneck that turns GPU capacity into startup delay during inference. When your endpoint scales from zero, your GPU may ...
- Can serverless GPU replace local LLMs? I reduced vLLM cold ... - This helped a lot. Cold start dropped from 460 seconds to 219 seconds (3 minutes 39 seconds). That is almost a 2x improvement. The main costs ...