
Photo by Andrew Neel from Pexels
Most product teams rely on OpenAI or OpenRouter status pages to know when their chat features are running. But a green status page tells you nothing about whether your users in Singapore are waiting 3 seconds for a response while your US users see 500 milliseconds. Monitoring LLM API latency by region, not just uptime, is how you catch degradation before support tickets pile up. This guide shows how to move beyond status-page checks and build production-grade latency visibility into your stack.
Key takeaway: Status pages only confirm uptime. To catch real performance degradation that impacts user experience, measure TTFB and TTFT latency by region, establish baselines for each region–model combination, and alert when latency degrades 30–50% above baseline—not on absolute thresholds.
TL;DR
- Status pages confirm uptime, not latency; a "healthy" API can still feel slow in certain regions or for specific model routes.
- Measure TTFB (time to first byte) and TTFT (time to first token) separately; TTFB hides token-generation latency that users actually feel.
- Set regional baselines and alert when latency rises 30–50% above your moving average; this catches degradation early without noise.
- Integrate latency data into weekly team summaries and incident playbooks so product and backend engineers see the same numbers.
- Use daily probes from 21+ global regions to compare OpenRouter, OpenAI direct, or other provider endpoints side-by-side in production.
Why Status Pages Aren't Enough

A status page is binary: green means the API is responding, red means it is not. But from a user experience perspective, "responding" is not the same as "fast enough."
Consider this scenario: your product team launches chat in three regions. OpenAI's status page shows "All Systems Operational." Yet your analytics reveal that 30% of conversations in Asia time out after 10 seconds. Your US users average 2.5-second wait times. Your European users wait 4 seconds. All three regions hit the same OpenAI endpoint, all three see a 200 OK response, yet the experience is degraded.
This is where regional latency monitoring fills the gap. A status page tells you whether the lights are on. Latency monitoring tells you how bright the lights are.
The Business Impact of Latency Blindness
When you don't measure regional latency:
- You ship slower: You cannot optimize routing if you do not know which regions are slow.
- You miss provider regression: OpenAI or OpenRouter may change infrastructure. A status page never hints at it until user feedback arrives.
- You lose pricing leverage: Without comparative latency data (OpenAI vs. OpenRouter, for example), you cannot negotiate or justify switching providers to leadership.
- Incidents take longer to resolve: Support tickets arrive before your team knows there is a problem.
Latency Metrics That Matter: TTFB vs. TTFT

Most teams check response times end-to-end. But LLM APIs have two distinct latency components, and lumping them together hides real problems.
TTFB (Time to First Byte)
Time to First Byte is how long the API takes to acknowledge your request and begin streaming the response. For LLM completions, this is when the first token appears.
Typical baseline: 200–800 ms, depending on region and model.
Why it matters: TTFB is what users feel when they send a message. A high TTFB makes your app feel unresponsive, even if the full completion arrives quickly afterward.
TTFT (Time to First Token)
Time to First Token is the time from request to the first token of output, inclusive of model inference. For streaming endpoints, TTFT and TTFB are often the same. For buffered endpoints (where you wait for the full completion), TTFT is shorter than total latency.
Typical baseline: 500 ms–3 seconds, depending on model complexity and queue depth.
Why it matters: TTFT tells you whether the model itself is slow or whether the API infrastructure is struggling.
The Regional Variable
Latency varies by geography. Direct OpenAI calls from a US data center may see 250 ms TTFB. The same call from Tokyo may see 800 ms due to network transit alone. If you only monitor aggregate latency, you miss the fact that your Tokyo users are getting a degraded experience.
This is where multi-region probes become essential. By sending probes from 21 global regions simultaneously, you can spot regional variances and detect when a specific region's performance declines without others changing.
Setting Up Baseline and Alert Thresholds

Once you are collecting latency data, the next step is defining what "healthy" looks like and when to alert.
Establish Baselines Per Region and Model
Your baseline is your moving 7-day or 30-day average latency for a specific region, model, and endpoint. OpenAI's GPT-4 Turbo in us-east-1 may baseline at 350 ms TTFB. The same model from Singapore may baseline at 1.2 seconds due to geographic distance.
Action: For each region and model combo you support, record the median and p95 TTFB and TTFT over 7–30 days of stable operation.
Alert on Degradation, Not Absolute Thresholds
Absolute thresholds (e.g., "alert if TTFB > 1 second") create noise because different regions have different baselines. A smarter approach: alert when latency rises 30–50% above baseline for that region.
Example:
- US baseline TTFB for GPT-4: 350 ms.
- Alert threshold: 350 × 1.4 = 490 ms.
- If US TTFB jumps to 600 ms, you get paged.
- Singapore baseline TTFB for GPT-4: 1200 ms (network distance).
- Alert threshold: 1200 × 1.4 = 1680 ms.
- If Singapore TTFB jumps to 1800 ms, you get paged.
Set Up Email and Slack Alerts
Most SaaS monitoring tools (including Observinio's alert system) let you define thresholds and route notifications. Set up:
- Email alerts for your on-call team when latency crosses thresholds.
- Slack notifications in your
#incidentschannel for visibility across product and backend. - Weekly digest emails summarizing latency trends by region and model; this helps product leadership understand provider performance over time.
Monitoring Workflow: Probe → Measure → Alert → Act
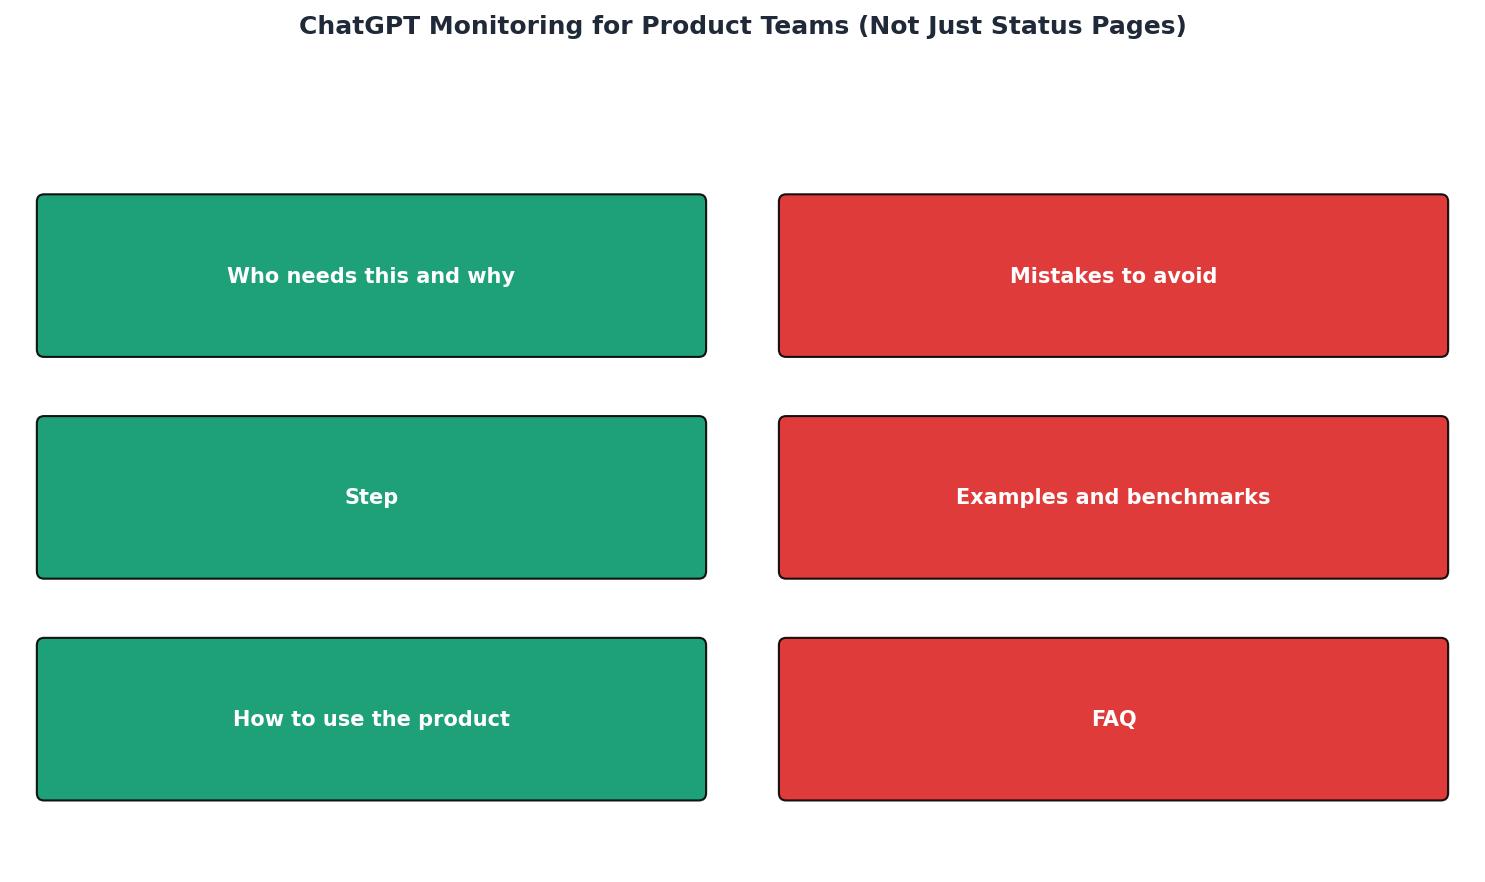
Here's the workflow your team should follow:
1. Deploy Synthetic Probes
Send identical API requests from 21+ global regions on a regular schedule (every 5–15 minutes). Each probe measures TTFB, TTFT, and status code. Log the results to a time-series database.
Tools:- Observinio: automated probes from 21 global regions; no config needed.
- Self-hosted: cron jobs + curl or Python requests, storing results in InfluxDB or Prometheus.
2. Compare Providers and Routes
If you use multiple providers (OpenAI direct + OpenRouter), send identical probes to each endpoint and store side-by-side. This gives you hard data: "OpenRouter us-east-1 is consistently 150 ms slower than OpenAI direct for GPT-4."
3. Establish Team Dashboards
Create a live dashboard your team checks during standups:
- Regional heatmap: Show TTFB by region in a color-coded grid (green = fast, yellow = slow, red = alert).
- Trend chart: Plot TTFB over time for each model and region.
- Provider comparison: Side-by-side latency for OpenAI vs. OpenRouter.
4. Trigger Incident Response on Threshold Breach
When latency exceeds your alert threshold, the monitoring system should:
- Page the on-call engineer immediately.
- Post a summary to Slack with region, model, provider, and recent baseline.
- Link to a runbook or playbook for that type of incident (e.g., "Regional latency spike, check provider status, consider failover").
5. Post-Incident: Extract Learnings
After the incident, log:
- Root cause: Was it provider infra, your routing logic, or regional network?
- Detection time: How long from spike to alert to page?
- Resolution time: How long to mitigate (failover, vendor escalation, etc.)?
- Baseline update: Did your baseline assumption change?
Practical Checklist: Build Your Monitoring Stack
Your progress is saved automatically in your browser.
Why Observinio Fits This Workflow
Observinio automates this entire workflow. Instead of stitching together curl scripts, databases, and alerting tools, you:
- Deploy daily probes across 21 global regions to OpenRouter, OpenAI, and other endpoints.
- Compare baseline vs. current latency with one click.
- Set regional degradation alerts; get paged only when latency meaningfully rises.
- Review weekly summaries showing trend data for all your models and regions.
- Access a live status page that shows not just uptime but regional latency at a glance.
"The more you work together, the more your dot learns your preferences, how you think, and what good looks like to you.">, Introducing dots
💡 Pro Tip: Start Small, Iterate Fast
You don't need all 21 regions on day one. Begin with 3–5 regions covering your primary user base (e.g., us-east, eu-west, ap-southeast), establish baselines over one week, then expand. Most teams add regional coverage incrementally as monitoring confidence grows and business needs become clearer.
FAQ
Frequently Asked Questions
Next Steps
Monitoring latency is not a one-time setup; it is an ongoing practice that improves as your team learns what "normal" looks like for your specific traffic patterns. Start by running probes for a week to collect baselines. Then set up alerts and integrate latency data into your weekly team sync. As your confidence grows, use latency trends to make routing and pricing decisions.
If you'd like to skip the self-hosted probe setup, Observinio's alerts cover this workflow out of the box: regional probes, baseline tracking, degradation alerts, and weekly summaries. Start your free trial and compare your providers today. With the right monitoring in place, your team will detect latency issues before users notice them, and you'll have the data to make informed decisions about provider selection and regional routing strategies.
Additional Resources
- Introducing dots - Your dot is always within reach, whether it is through ChatGPT, Slack, or Teams. You can ask questions, explore ideas, and give feedback along ...
- Sites - Sites lets you build, host, and share a website by describing it in ChatGPT or Codex. You can get started without writing any code.
- OpenAI ChatGPT status - StatusGator monitors all of your services and websites and sends your team instant notifications when they go down. Stay abreast of issues that affect your team ...